
Many users of site reports tend to look most carefully at the first number which appears on the report – the estimate of the current population – as the primary indicator of the likely market size in a trade area. This is most common during the initial phase of analysis in a particular market, where areas are included if they reach a certain threshold population and rejected for further consideration if they don’t.
But total population is not necessarily the best initial measure of trade area size, and just as with measures of “daytime population” which we discussed a few weeks ago, the metric chosen as the threshold variable can result in erroneous initial filtering.
The starting point is to define the parameters which most closely parallel the actual nature of the customer base. Key is to define the base “consuming unit” for the business.
Most durable goods are purchased based on household considerations, even if one person in the household might be the decision maker. Convenience goods tend to be oriented towards individuals rather than households. The three most common consumer unit bases are:
- Population
- Adult population
- Households
Further consideration should be given to the details – which could include:
- Group quarters population. Most institutional populations do not often frequent local retail establishments, and these should be eliminated where possible. (In a household demand model, these are already not present.)
- Age, sex, and ethnicity considerations. Some retail stores are obviously oriented towards male or female products, but also may have a definitive age skew. Certain ethnic groups may have language barriers or product preferences that should be considered. Some products may be purchased by adults on behalf of children, in which case more appropriate measures may include looking at families with children rather than population or households.
- Tourist population. This is rarely considered and may be a significant positive benefit in most cases, but is likely an impediment to sales of durable goods if there is traffic congestion related to tourist attractors.
- Other Factors. These include housing type and tenure, vehicles available and special demand groups like college students, military, or even public sector workers.
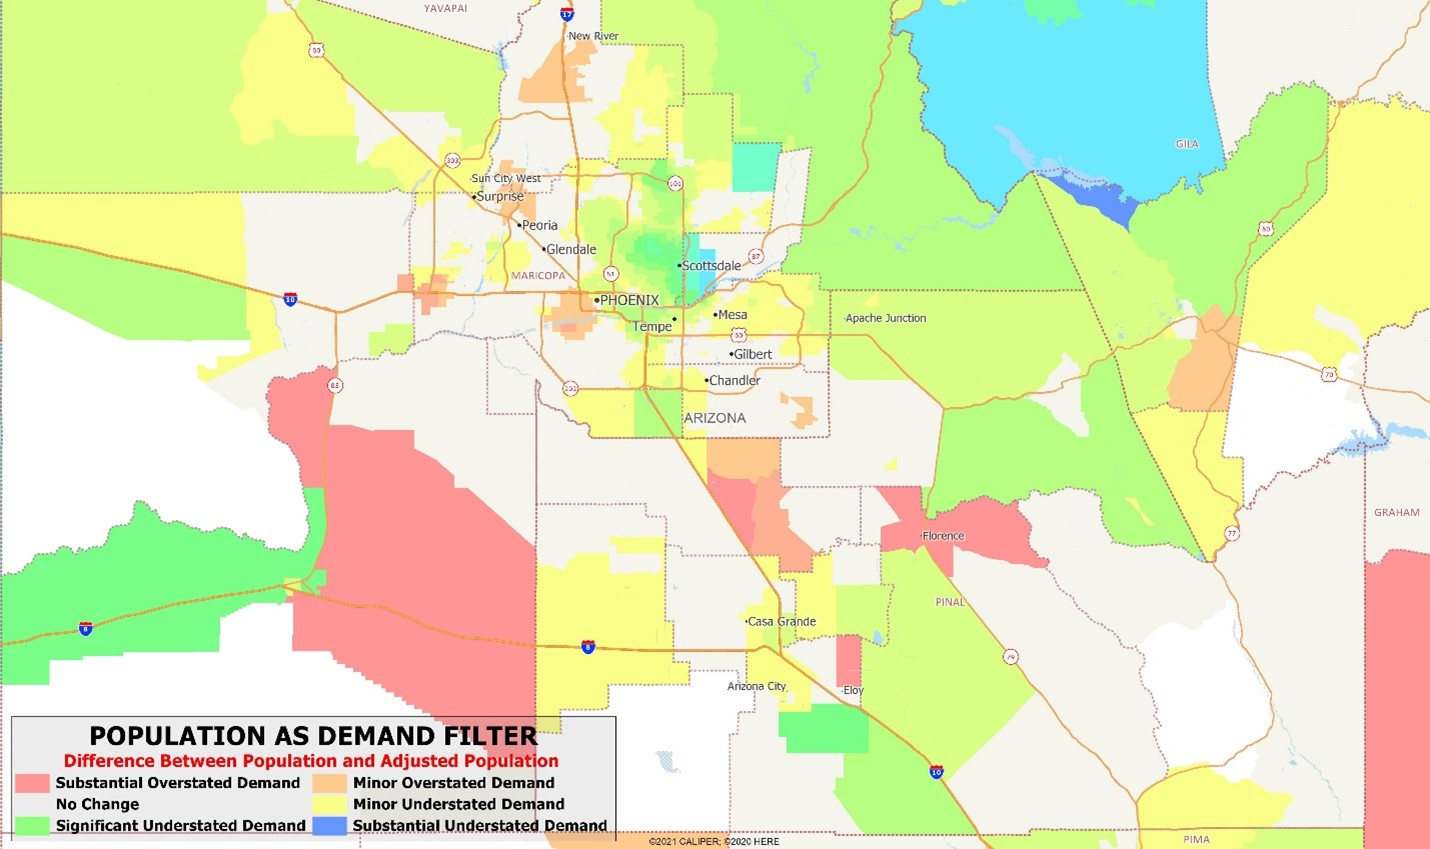
Even simple changes – like subtracting institutional population and adding in overnight tourists – can have major changes. The map below uses a three mile radius around each block group centroid and shows the percentage difference between the simple population measure and an adjusted measure. Areas in red are significantly overstated demand – largely because of the presence of correctional facilities – while areas in green and blue are understated because of tourist traffic. Note particularly the area of overstated demand just west of downtown.

Recent Comments