Many companies include something called “daytime population” as part of their standard demographic reporting when considering new sites or evaluating performance of existing sites. Many restaurants rely on the lunchtime trade as a critical element of their success.
Take a traditional 15-minute drive time study area for a retail location. The daytime population of that area would include:
- Employees at the establishments in the study area
- Persons who are not employed
While simple sounding, the concept suffers from some serious deficiencies that users should understand. Daytime population weights all components as equivalent — the two-year-old, the CEO of the manufacturing company, the annoying middle schooler, the long-term guest of the state corrections department, the long retired engineer, the stay-at-home dad who is raising said annoying middle schooler, the tourists in town for the Star Trek convention, the employee of the nursing home and the resident of the nursing home! And don’t forget, the employee who used to take the train downtown and now works from home and is not intending to ever go back to commuting.
As we often prattle on about in these pages, the details matter. Knowing that a perfect measure is simply not going to happen, we at least propose the following be considered as components of daytime population:
- Employees at establishments in the study area. (While we would like to adjust these numbers for some occupations or establishment types to account for field workers, the problem is that we would simply lose sight of them and count them nowhere, so we would leave this be for the time being).
- Population under 18
- Population over 18, not in the labor force. Ideally, we split these into full time students, retired persons, and everybody else – since they are likely to show very different demand patterns.
- Persons in the labor force who work at home
- Non-resident population, which can be seasonal
From these, we suggest removing the population that is in institutional group quarters, generally not considered to be likely consumers.
Are these measures exactly what you need? Of course not. We will have an article in the next few weeks on choosing demand variables explains why there is no “universal” number that we can use. That said, we did a little mapping – one of our favorite leisure pastimes – and looked at the patterns using different definitions of daytime population. To smooth out the maps, we used two-mile radius areas around each block group centroid:
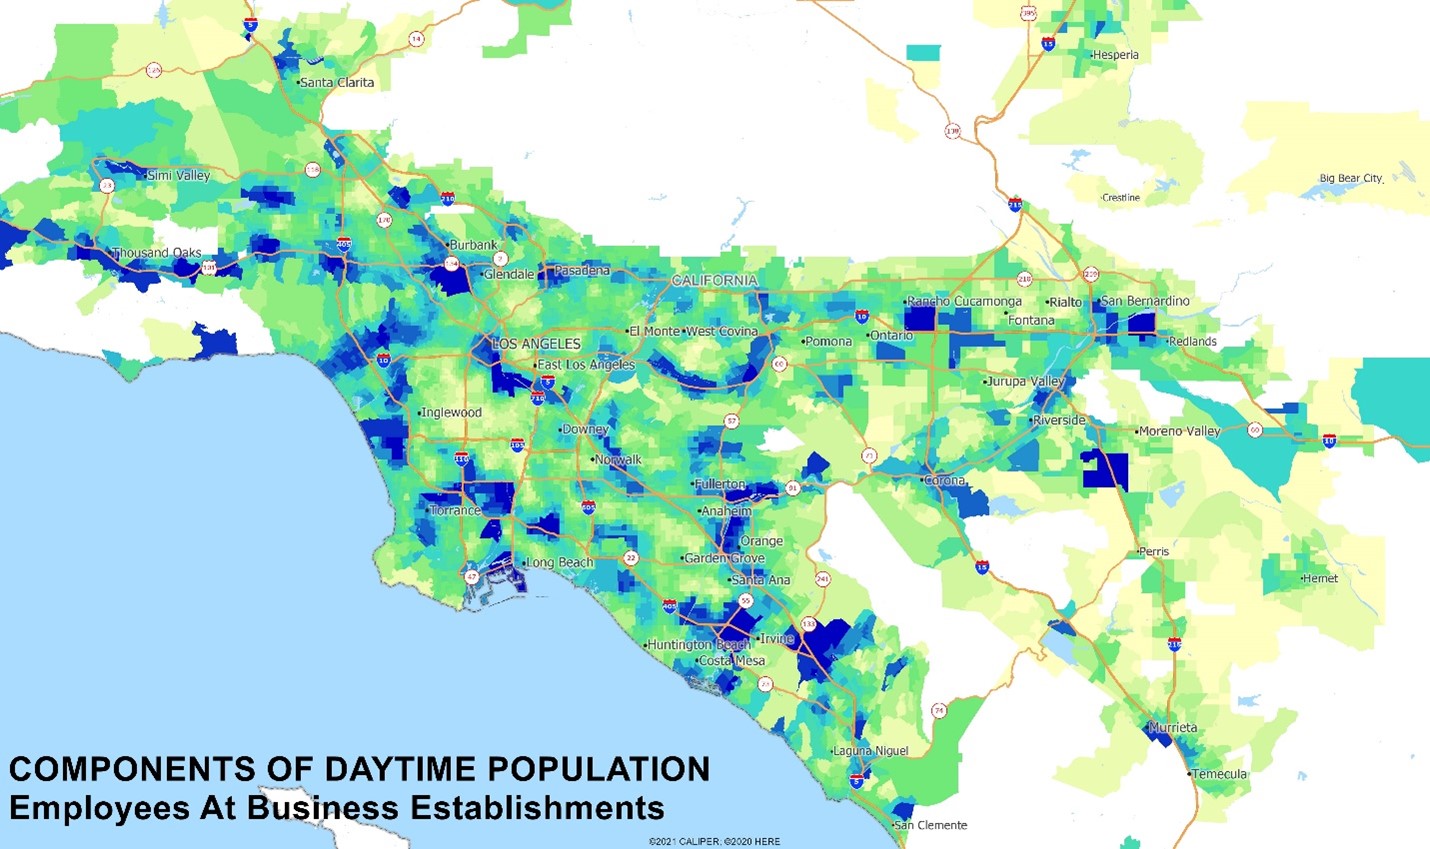
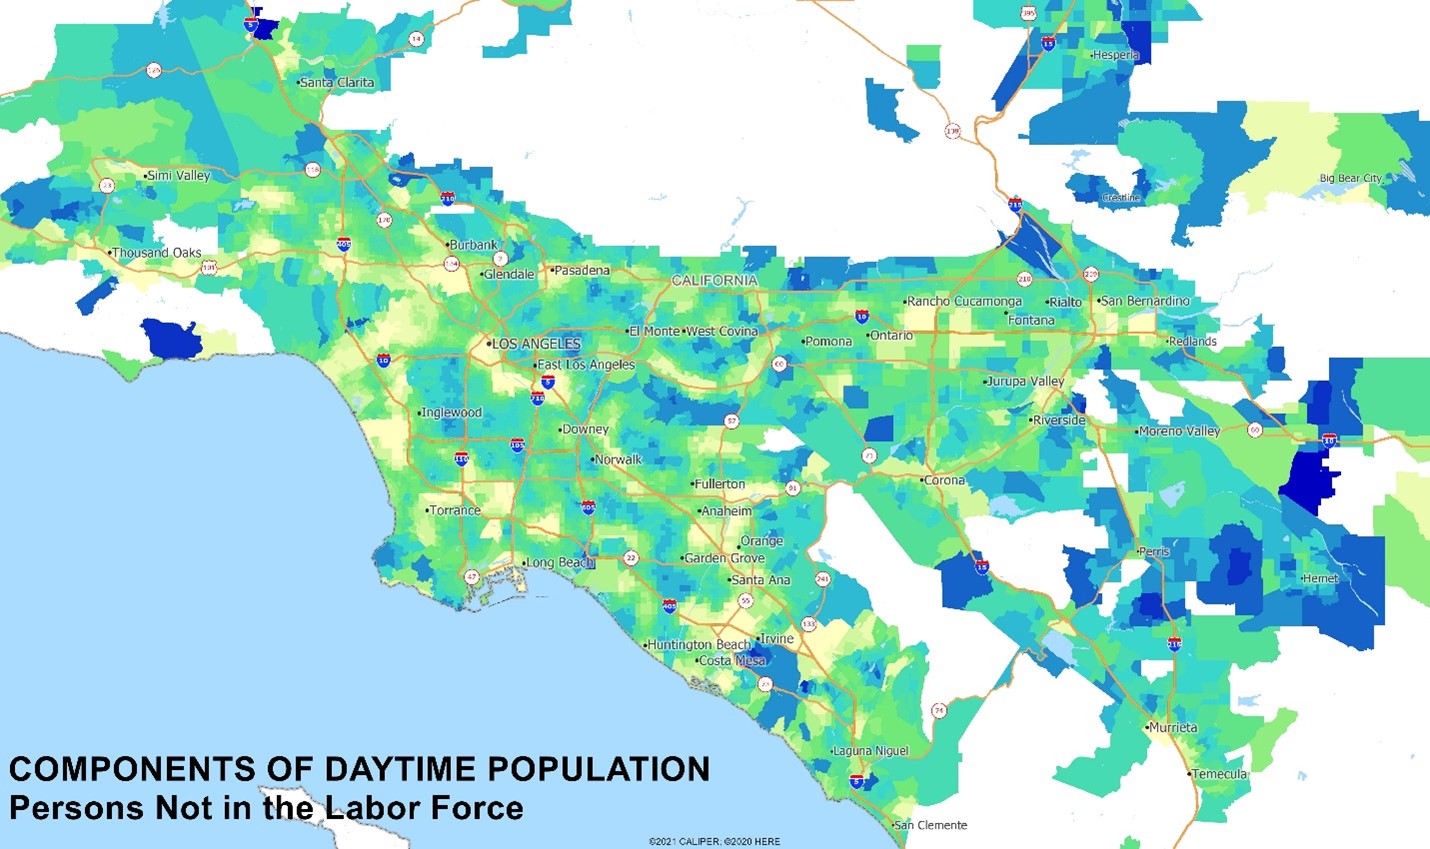
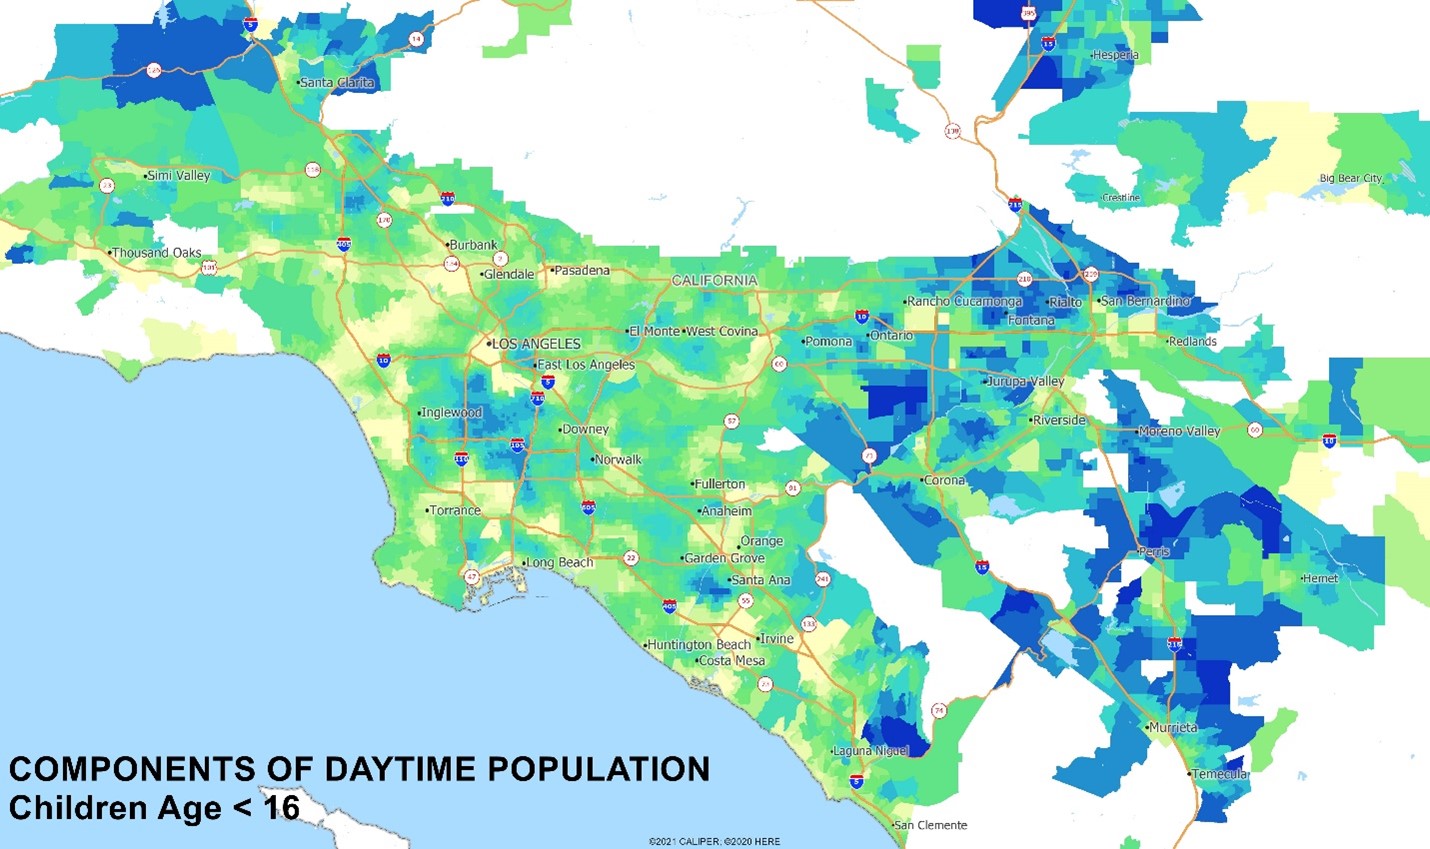
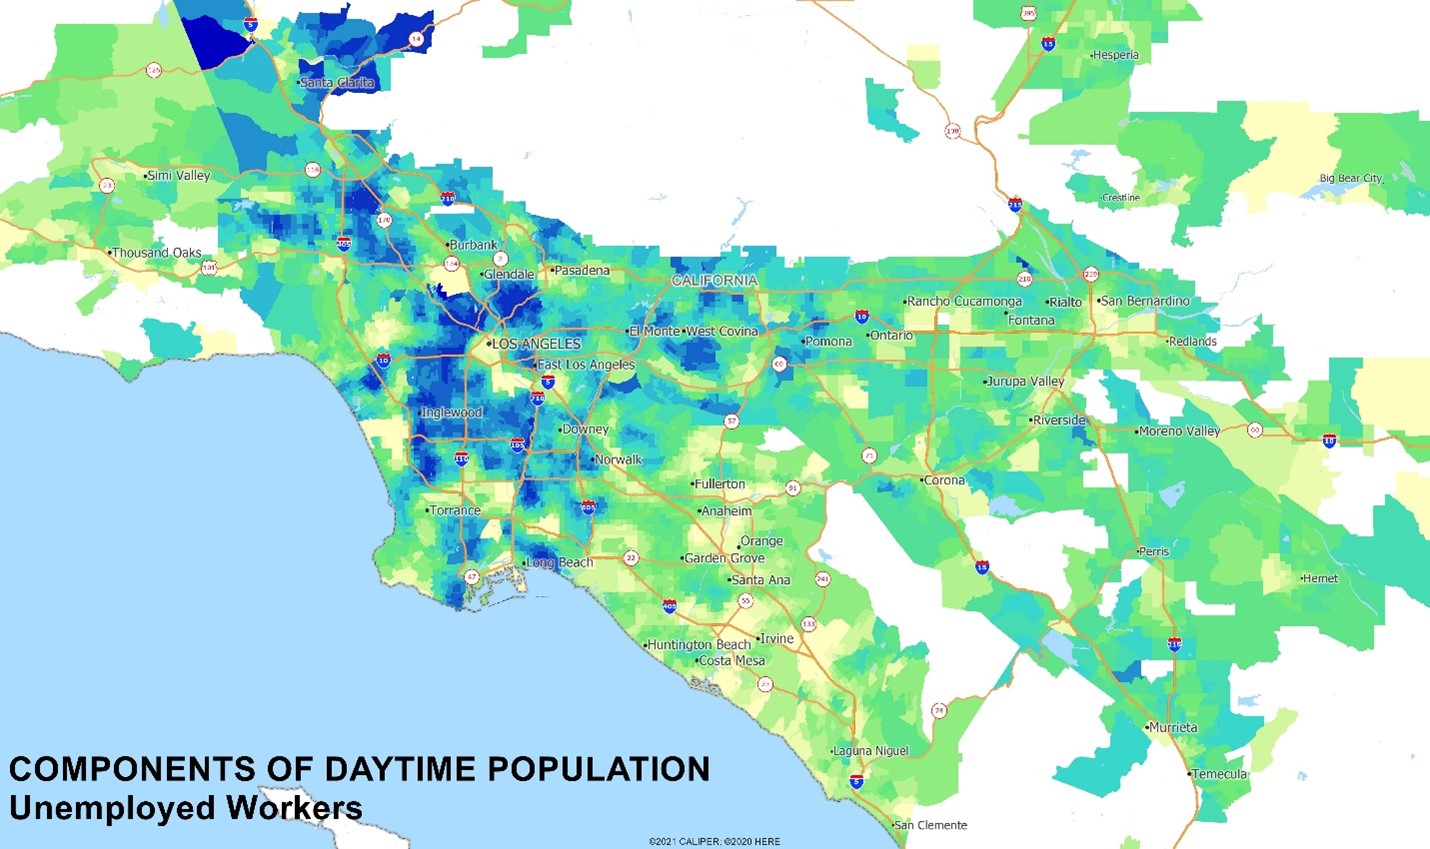
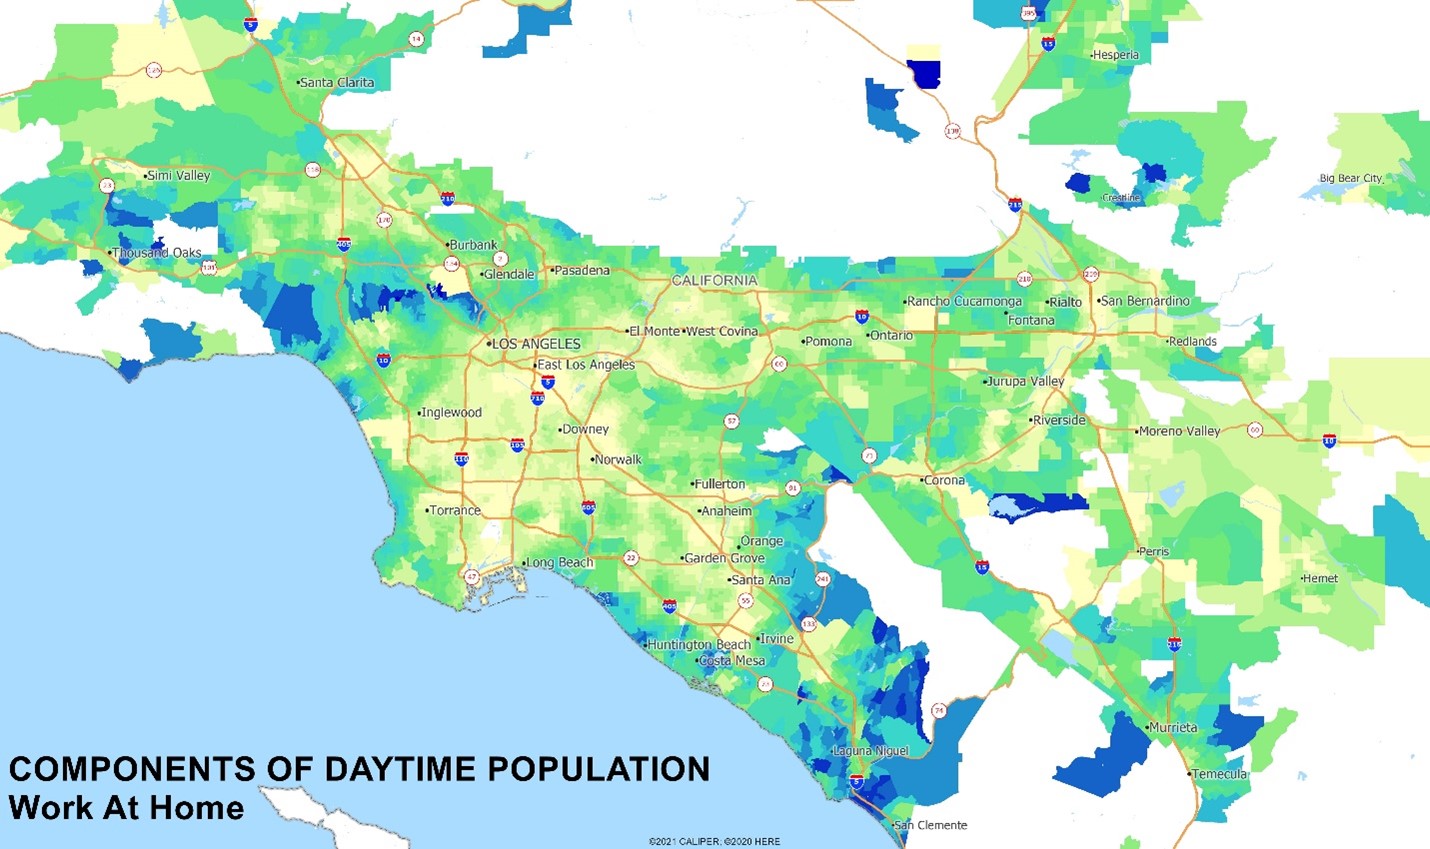
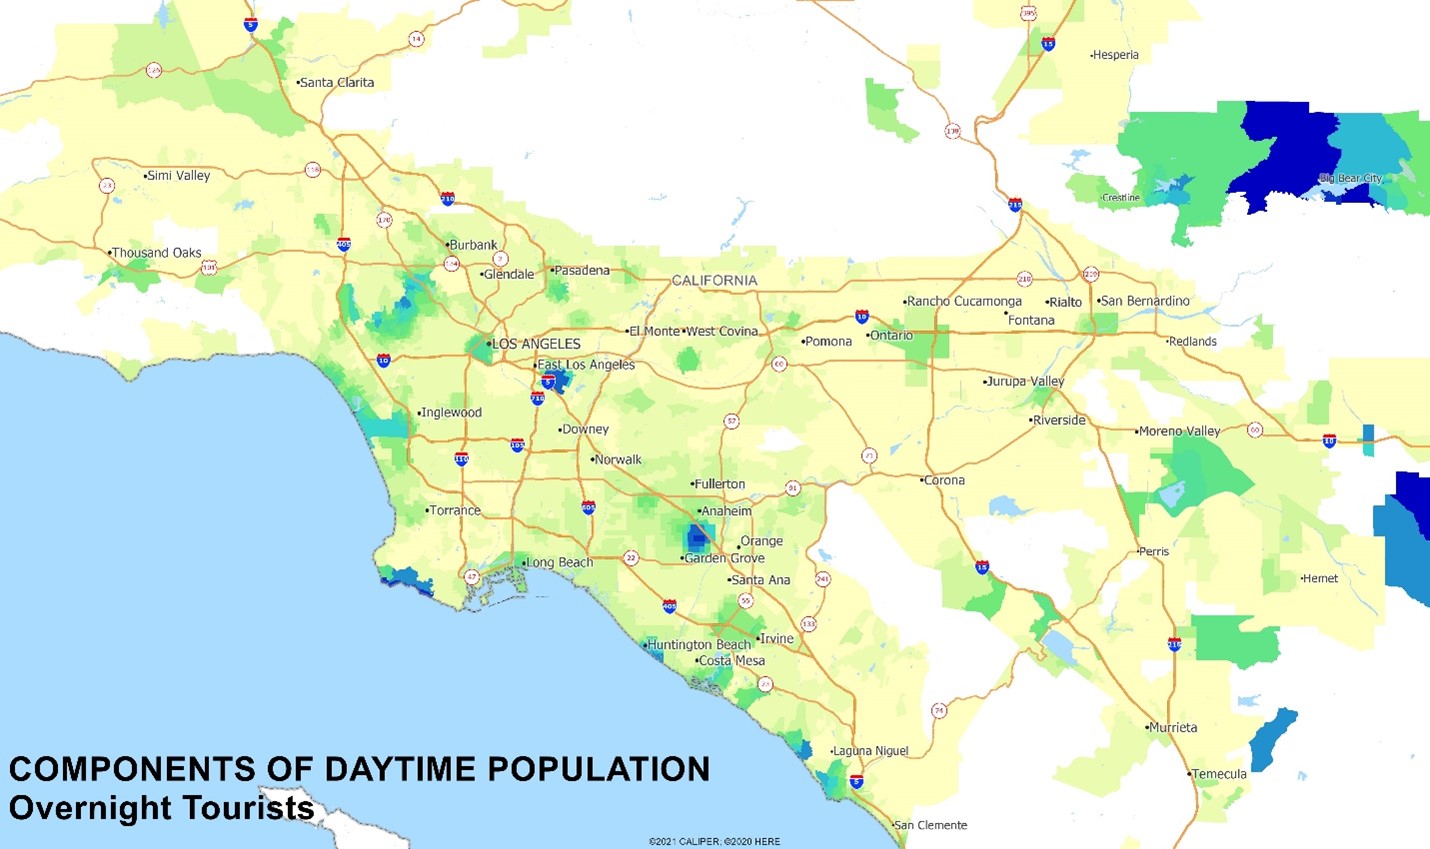
The different spatial patterns of the components of “daytime population” are striking, and since for most retail businesses, these groups have markedly different demand characteristics, this should perhaps trigger an evaluation of the metrics being used for site evaluation. Simply reviewing the daytime population as a whole may give you very misleading results.