
It’s no secret that we are big fans of small area geography. So, when someone tells us they want to analyze a market using ZIP codes, a small piece of us dies inside. (Okay, it’s not that dramatic.) ZIP codes have their uses, but they often cover too much ground to show what is happening from one neighborhood to the next.
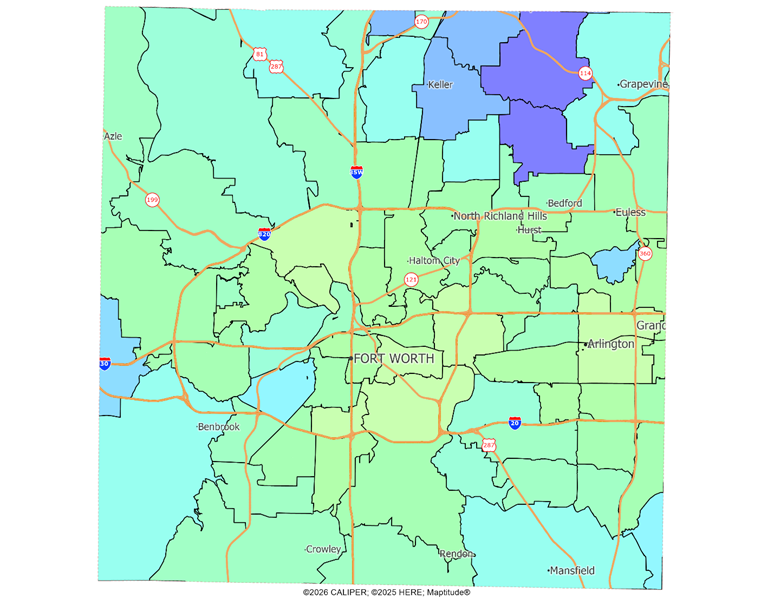
Fort Worth offers a good example. The maps below show average household income from AGS’s 2026A release. They use the same colors and income ranges; only the level of geographic detail changes. In the first map, each ZIP code gets one color, blue representing higher incomes, green lower incomes. You can see some broad differences across the region, but the wedge of higher income neighborhoods stretching from near downtown toward Benbrook and beyond is difficult to pick out.
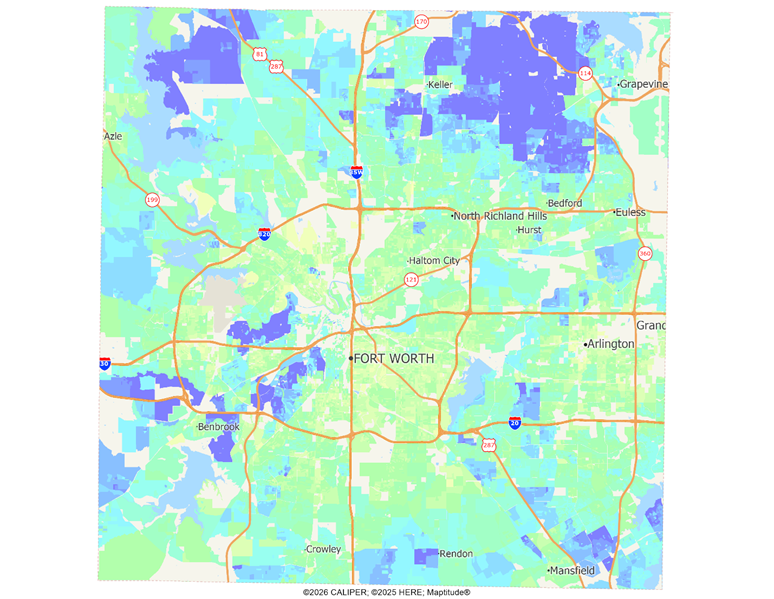
Now look at the same area by Census block. The higher income areas to the north are more concentrated than the ZIP code map suggests. More strikingly, several distinct clusters within the wedge become visible. The ZIP code map smooths those clusters into their surroundings, even though the underlying income patterns have not changed.
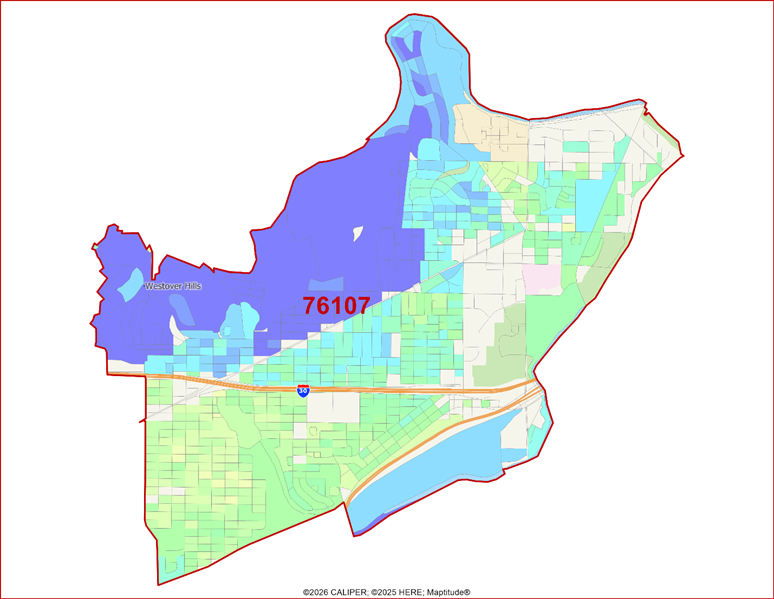
Zooming in on individual ZIP codes makes the problem clearer. ZIP code 76107 includes Westover Hills and nearby high income neighborhoods in its northwest portion, along with areas south of Interstate 30 that have substantially lower average household incomes. A single ZIP code value cannot describe both ends of that range.
ZIP code 76109 tells a similar story. Areas near and west of the university (TCU has it’s own ZIP code, 76129) differ markedly from areas to the south and east. Viewed as one ZIP code, 76109 may not stand out as especially high income. Viewed in greater detail, it contains substantial pockets of higher income households that a ZIP code map can hide.
This matters because income can change sharply over a short distance. The same is true of many variables used in site selection, marketing and community planning. When a large geographic area gets one average, meaningful differences within it disappear. An average may accurately summarize the ZIP code as a whole while still being a poor description of the customers near a particular site.
The issue extends beyond how a map looks. Imagine comparing two potential retail locations with similar household counts and average incomes within a 15-minute drive. Those totals might suggest the sites are interchangeable. A closer look could show that one trade area contains a compact cluster of target customers near the proposed location, while the other barely includes a comparable cluster at its edge. It could also reveal a strong cluster just outside the drive time, suggesting that a modest shift in location might reach more of the intended audience.
That is why trade area analysis should examine the distribution of people within the boundary, as well as the totals for the area. Small area maps, potential surfaces and spatial hotspot analysis can help identify clusters of neighborhoods that match a target customer profile. They can also show where a promising area begins and ends, rather than treating every household inside a ZIP code or drive time as equally relevant.
Broad geographies are useful for a broad view. But when the decision depends on where customers actually live, work or shop, spatial detail can change the answer.