
In this fourth and last of a series, we turn our attention to what really matters – what the data intensive Vortex model actually produces. If you haven’t followed this series, you can go back and read:
- Peering Through The Skunkworks Windows (https://appliedgeographic.com/2026/10/08/peering-through-the-skunkworks-windows/)
- Fueling the Vortex (https://appliedgeographic.com/2026/10/15/fueling-the-vortex/)
- Inside the Vortex (https://appliedgeographic.com/2026/10/22/inside-the-vortex/)
Using a broad range of time series data, standardized to a detailed hex grid, the Vortex model provides estimates of 29 key demographic variables, the most important of which are dwellings, households, and population. Forecasts are made for six time periods, including the current year, and include standard error estimates. Each run of the model utilizes additional data which continues to improve those error estimates.
One of the key outputs of the model is a change classification, and the classification of any particular geographic area can and does shift over both the historical and projection years. That classification consists of the following groupings:
- Growth
- Greenfield expansion
- Infill densification
- Steady growth
- Stable
- Ageing in place
- High churn
- Gentrifying
- Static
- Declining
- Disaster destruction
- Household shrinkage
- Income decline
- Decline
- Abandonment
- Special Categories
- Institutional / Group Quarters
- Seasonal / Resort
The ‘stable’ group does not mean that change is not occurring – it simply means that the household count is not changing over time, even though the other demographic estimates such as income or life stage may be shifting rapidly. For example, gentrification changes the characteristics of the households, but often without major change in the household or dwelling counts.
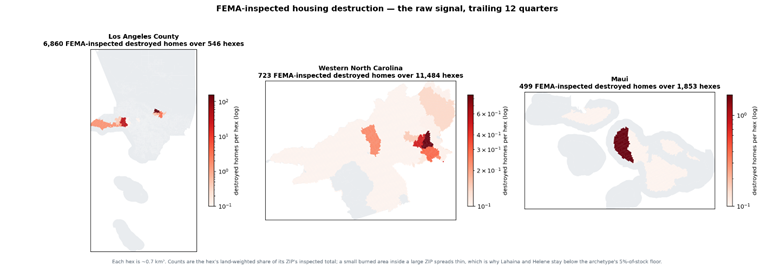
Special attention is paid to areas with natural disasters, and the graphics below show the areas of destruction in three separate areas:
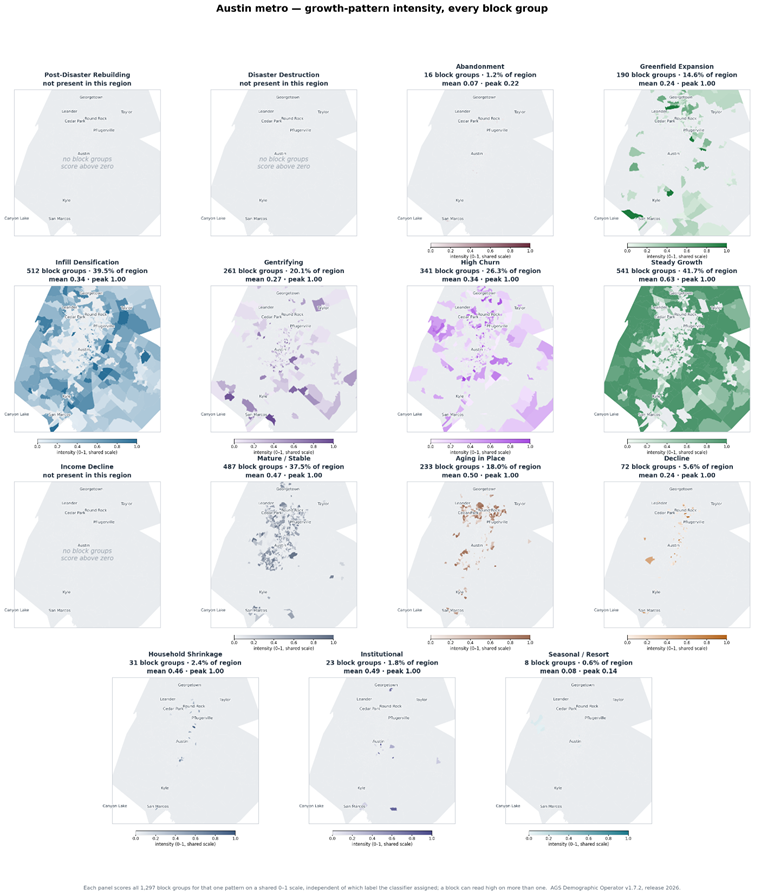
The map series below shows the probability of membership for each of the output types for Austin, Texas.
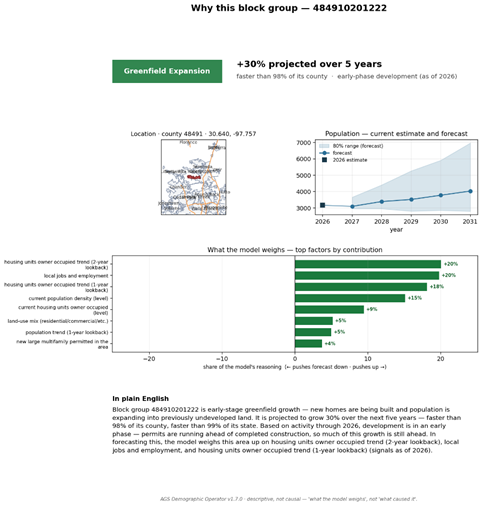
For any individual area, the model can provide a summary description of how its forecast was assembled. In the example below, a block group in Austin has been classified as “Greenfield Expansion”, and is predicted to grow by about 30% over the next five years:
Vortex results have been incorporated into our 2026B release, expanding upon the thousands of models which have been developed and refined over the years. Together, these constitute the most accurate small area estimates and projections available. And as we continue to enrich Vortex with additional spatial and temporal data, our ability to predict major changes will only improve.