
Regular readers of our weekly newsletter know that a couple of years back we set out to completely reengineer our source datasets and methodology for creating our core demographics. Our stated goal was that we would know about every single building in the United States within at most three months of its completion. Not by coincidence, we wanted this to be ready by 2030. It is an audacious goal – in effect, we want to be more accurate than the Census Bureau, despite having a mere fraction of their resources and without a legal framework which compels people to give up their personal data.
Today, we thought we would sneak through the back door into our skunkworks to see how we are doing. Unlike the famous original, located in the somewhat harsh surroundings of California’s Mojave Desert, our Skunkworks is located in a quaint Carolina beach town. It is headed up by none other than our resident astrophysicist, Thomas Cannon. And yes, there is but one skunk in the works.
What began as a massive data collection exercise has morphed in recent months to become the Vortex project, which is a highly complex analytic overlay on the datasets we have created and integrated to date.
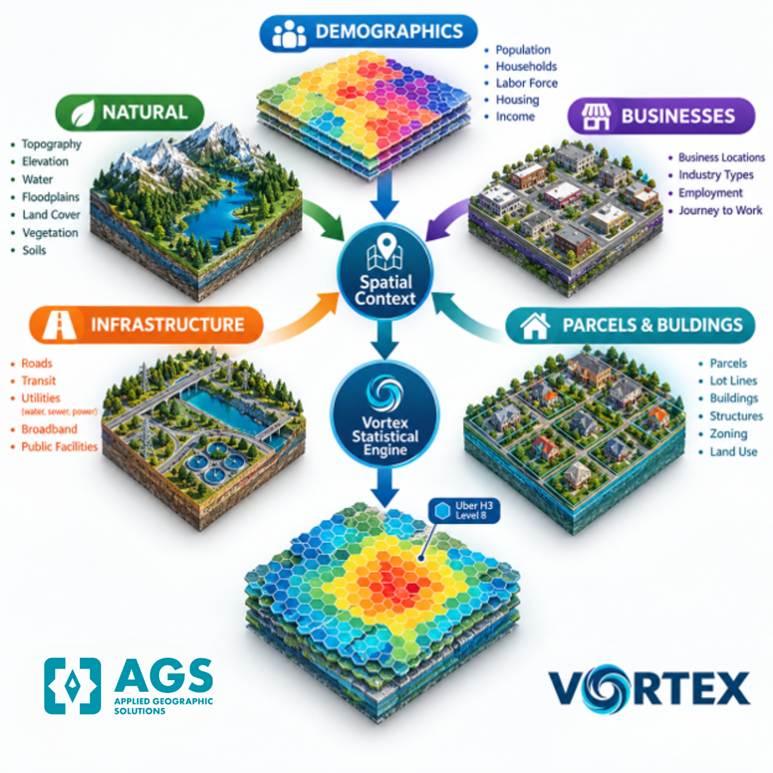
The Vortex engine ingests a very broad range of detailed data, much of it time series, in order to project key demographic variables like population, households, and dwelling units. These are then fed into our existing processes that include hundreds of individual models and thousands of lines of code.
In a series of articles, we will explore the Vortex from three vantage points – the underlying spatially aware data ecosystem, the model itself, and the outputs of the model and how we are integrating them into our 2026B estimates.
But first, a little fun….
The Vortex engine is AI friendly, which allows for scenario testing in not quite real time. A typical simulation run takes several minutes to process, since changes to the landscape tend to have ripple effects.
Last week, the first new steel mill in the US in decades was announced, and we thought we would see what might happen in southeast Iowa. We plunked a steel mill on the ground, roughly where the press release said it might be, and gave it 1750 employees. Not surprisingly, adding that many employees to a relatively rural part of the state had a significant impact:
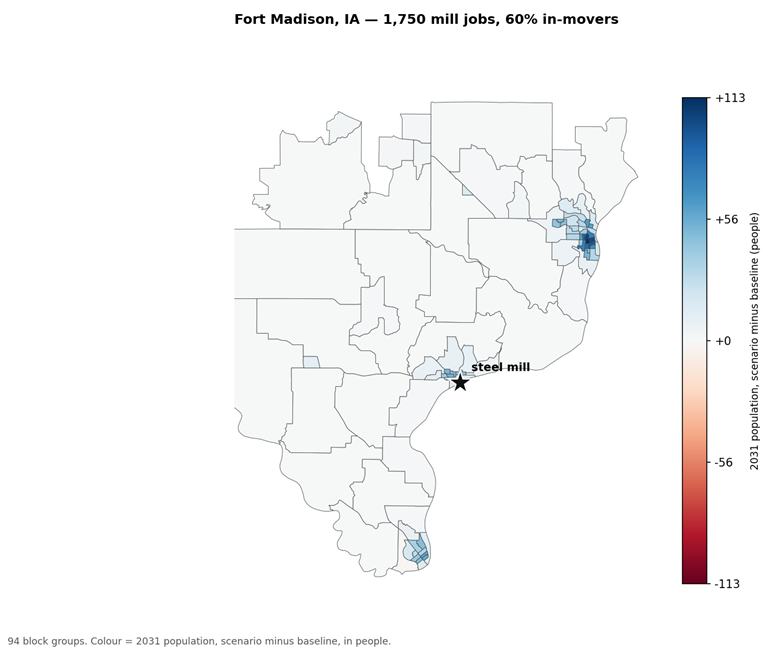
Not surprisingly, the major growth occurred in the larger town of Burlington, IA a few miles to the north, adding about 15,000 people to the area, since the model is aware that there are substantial economic multipliers at work here. The model correctly understood that the existing labor force was insufficient to staff the new mill and import people from elsewhere. In fairness, we would normally pick up some of the signals of impending development through parcel ownership changes and permits, and you would expect to see at least one or two new home projects taking shape.
To check on the model, we located that same plant on the land occupied by the long-mothballed Bethlehem steel plant in Lackawanna, NY. This barely moved the needle, since the labor force in the metropolitan area is large enough to absorb a large employer.
As a further test, and with apologies to the fine residents of Eureka, CA, we introduced a 20 foot tsunami. The model correctly identified low lying areas where the tsunami would hit, and pretty much wiped out most of the coastal development.
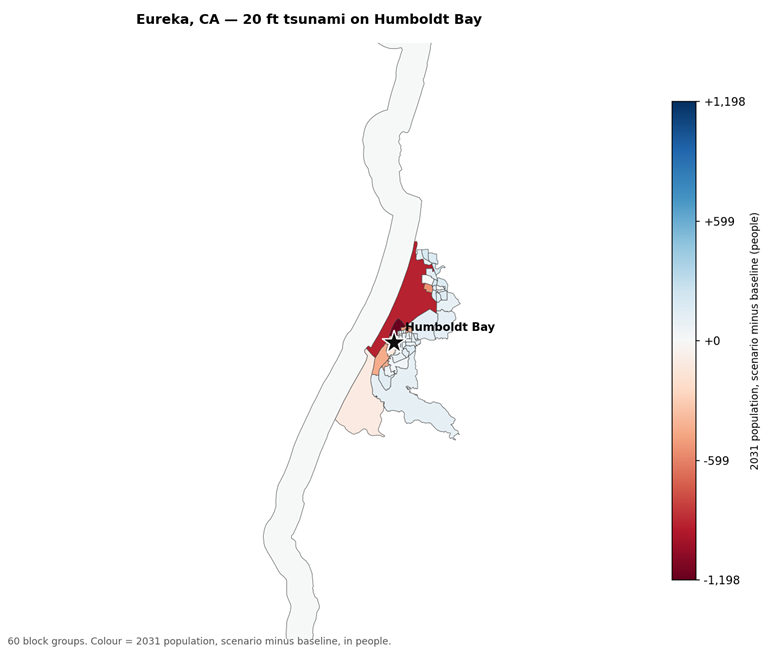
Typically, in disaster areas, the greater the percentage of homes destroyed, the slower the rebuilding process, but there seems to be a tipping point where people simply don’t want to return. Our imaginary tsunami displaced about 6,500 people, with most leaving the area entirely. What is interesting is that after five years, only about 1,500 returned to rebuilt houses.
Finally, and definitely a bit out there, we crashed a large UFO in Newburgh, NY. Quite sadly, the crash wiped out the downtown area and the vital I-84 bridge over the Hudson River. Given that such crashes are rare events, the model repopulated the downtown more rapidly than in the Eureka simulation. Interestingly enough, the model was unable to effectively account for the loss of the transportation link, largely because it only had two known examples to work with – the I-35W collapse in Minneapolis which predates the main data series, and the 2024 collapse of the Key Bridge in Baltimore. The model declined to modify its forecasts resulting from the bridge damage.
Next week’s article will discuss the data sources we have already integrated into the Vortex model and talks about the planned additional data to be added over the next few months – especially as we discover the limits of the model that we can mitigate with additional data.