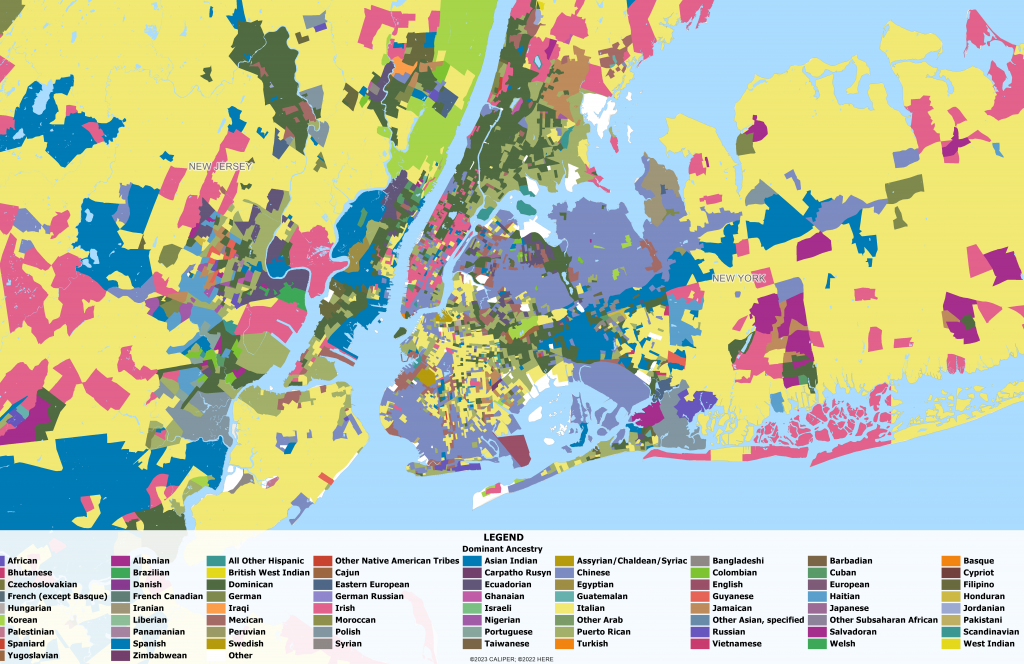
When you think about ethnic ancestry as it relates to geography, you probably think about neighborhoods where large immigrant groups settled together, like New York’s Little Italy and San Francisco’s Chinatown. Immigrants settled this way very intentionally, as they could ease their way into American society by locating in neighborhoods where their native tongue could be heard and there were often extended family relationships. Across America today, most ethnic groups are dispersed, but some concentrated groups remain. Is America a melting pot, or something closer to a patchwork quilt?
Many historic neighborhoods, like Little Italy, no longer look like they did when they were first settled. The height of Italian ethnicity in the area was 1910, when some 10,000 people, 90% of the population, identified as being Italian. Much like most settlements, this is not the case today. By the second and third generation, the early immigrants, especially from Europe, tended to disperse at least regionally. Non-English languages tended to be lost by the third generation. However, some regional differences in ethnicity remain.
Measuring ethnicity is very difficult. While it is asked on the Census, many will report multiple ancestries, some which may be up to a few hundred years down the family tree depending on when the largest immigration surge from each region occurred. In addition, some people report ‘American’, many don’t report at all, and some report obscure ethnicities such as Alsatian or Basque.
The largest ethnic groups in the United States are:
| British Isles | 26.9% |
| German | 15.1% |
| Mexican | 13.2% |
| Italian | 5.7% |
| Polish | 2.9% |
| French | 2.3% |
| Puerto Rican | 2.0% |
| Asian Indian | 1.9% |
| Chinese | 1.8% |
| European | 1.7% |
| Norwegian | 1.4% |
| Filipino | 1.3% |
| Swedish | 1.2% |
| Dutch | 1.1% |
| Russian | 0.9% |
| Salvadoran | 0.9% |
| Cuban | 0.8% |
| Dominican | 0.8% |
| Vietnamese | 0.8% |
| Native American | 0.7% |
| Spanish | 0.7% |
| Korean | 0.6% |
| Guatemalan | 0.6% |
| African | 0.6% |
| French Canadian | 0.6% |
This needs to be interpreted with considerable caution. Some will report hybrid ethnicities, like “Scottish-Irish”, which for our purposes, we have used “British Isles” to include English, Irish, Scottish, and Welsh. Additionally, many Canadians have moved to the United States over the years, but the identification of Canadian as an ethnicity is very low, as English-speaking Canadians are more likely to report their origins from Europe and Asia than are French Canadians. These are just two examples of how this data should be interpreted.
If we exclude the three largest groups – British Isles, German, and Mexican – we get some interesting patterns, as seen on the map below.
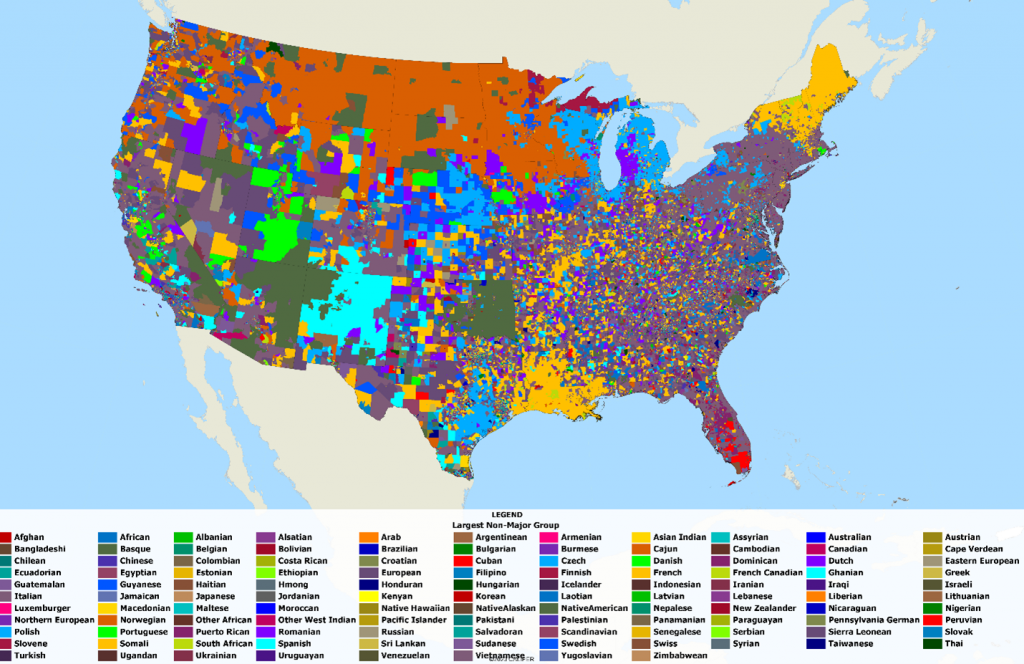
This minority-majority map is interesting, since of the 121 groups we used for this analysis, only 3 were not the minority-majority in at least one block group.
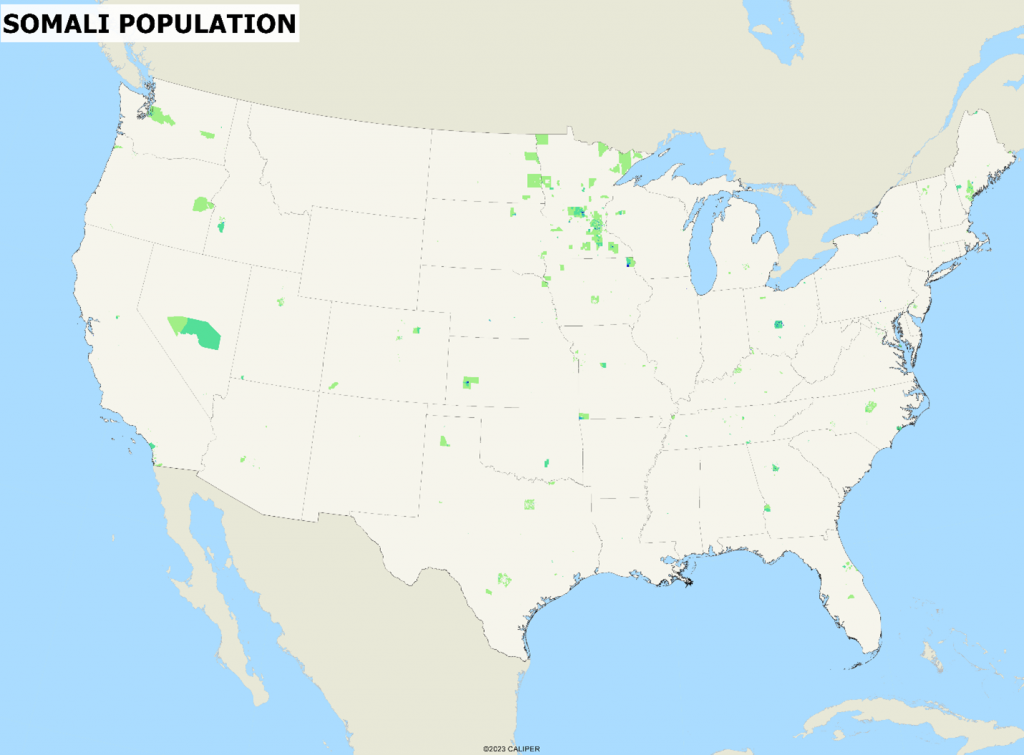
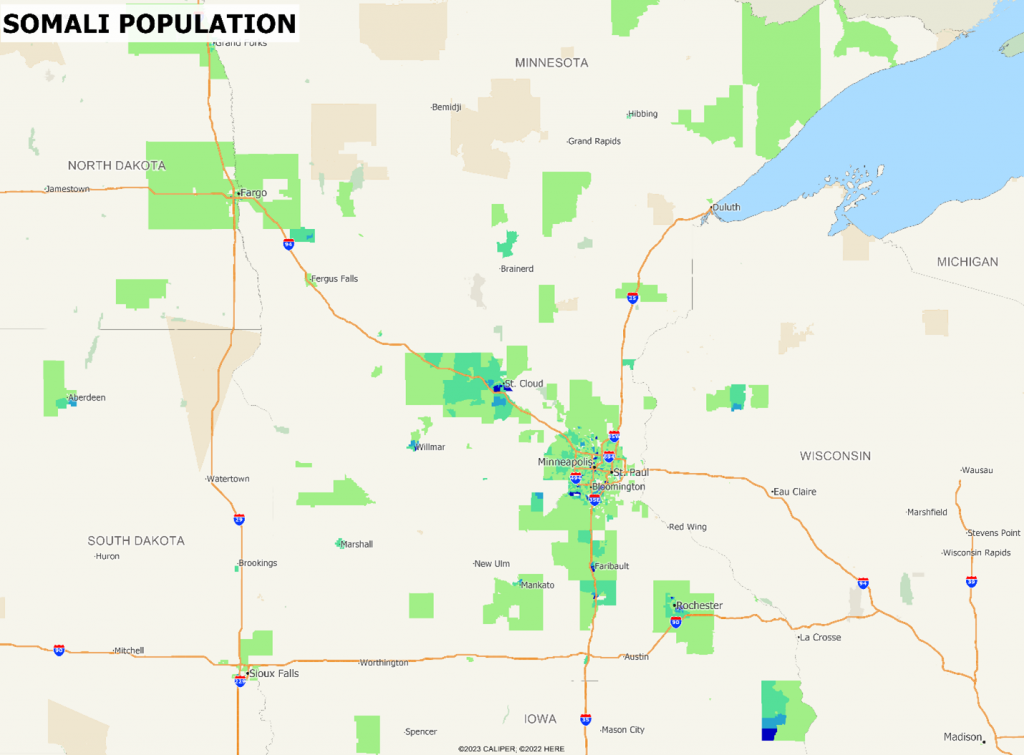
While there are some interesting regional patterns, we became interested in some relatively small ethnicity groups which are particularly concentrated geographically. The first example is the Somali population, which are highly concentrated in Minnesota, particularly in selected areas of the Minneapolis-St. Paul metropolitan area. Most arrived as refugees and were deliberately settled in just a few areas – Minneapolis, Columbus, Seattle, San Diego, and Fort Worth. There are many block groups in these areas where the Somali population is not the minority-majority, but the majority population, which we highlight on the maps below. Many of these are rural and/or small towns. The second map, which shows the Somali population in Minnesota, shows interesting settlement patterns. Time will tell if these people continue to live in communities together or disperse like other groups before them.
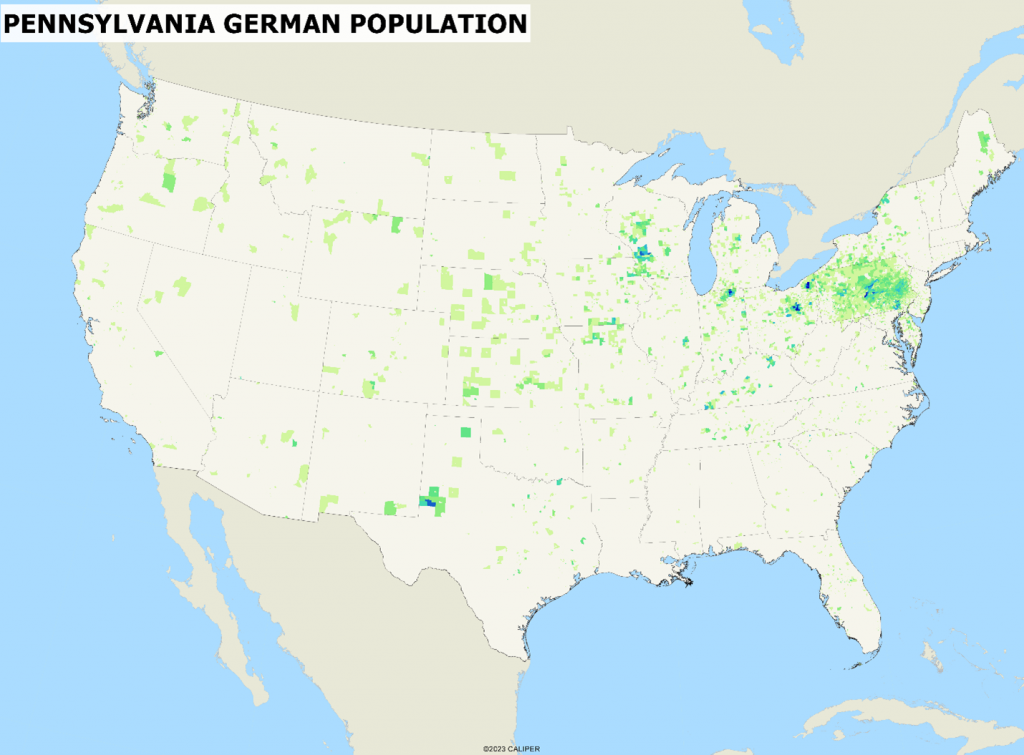
The ‘Pennsylvania German’ ancestry on the other hand have been in the United States since the early days of east Pennsylvania. Unlike other groups, which have dispersed, communities of Pennsylvania German have become established in many areas of the country (see map) – note that they are clustered in multiple areas now.
As for New York? Little Italy today looks much like the rest of the country—a patchwork quilt of ethnicities all woven together making America unique.
