To most Americans and Canadians, Mexico is a vacation destination. Our understanding of the country often begins and ends with beaches, gated resorts, cruise ports, and a handful of familiar brand-name cities. While tourism is an important part of Mexico’s economy, it represents only a small slice of a country that is geographically vast, economically complex, and culturally diverse.
Our mental model of Mexico is also shaped—somewhat unfairly—by centuries of cartographic convention. Thanks to the navigation-oriented brilliance of Gerardus Mercator, whose projection preserves angles and shapes at the expense of size, Mexico often appears much smaller than it truly is. In reality, Mexico is roughly three times the size of Texas, stretching nearly 2,000 miles from north to south, with a border with the United States that is almost equal in length. It is a continental-scale country, and understanding its geography is essential to understanding its population, economy, and data patterns.
This primer serves as an introduction to our upcoming state-by-state series on Mexico, grounding the analysis in national patterns before we zoom in.
Mexico’s physical geography is defined by mountains, plateaus, coastlines, and dramatic elevation changes. The country is dominated by three major mountain systems: the Sierra Madre Occidental along the west coast, the Sierra Madre Oriental along the east, and the Sierra Madre del Sur in the south. Cutting across the center of the country is the Trans-Mexican Volcanic Belt (also known as the Sierra Nevada), which runs from Tepic on the Pacific coast to Veracruz on the Gulf of Mexico.
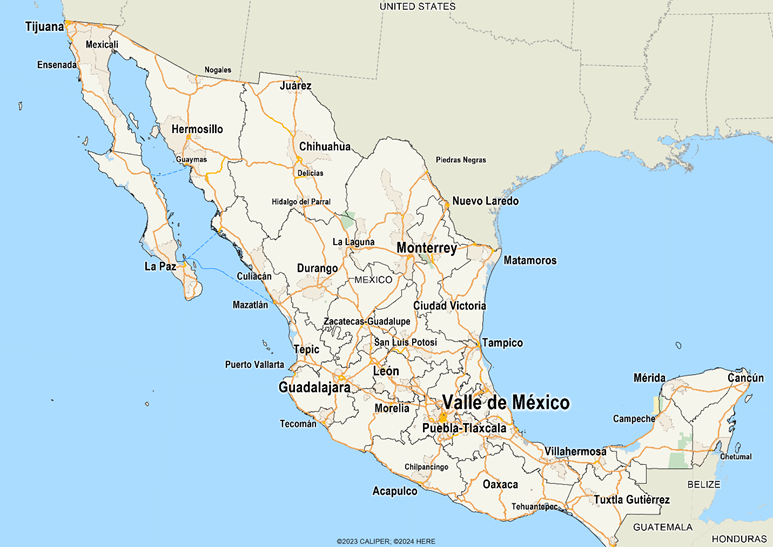
This volcanic corridor is one of the most important geographic features in Mexico. It contains some of the country’s most fertile soils and supports many of its largest metro areas, including Mexico City and Guadalajara. As a result, a significant share of Mexico’s population lives either in the coastal plains or in the highland valleys formed by this volcanic range.
Climate patterns closely follow geography. Rainfall is lowest in the arid and semi-arid northwest, gradually increasing toward the tropical and subtropical southeast, where dense rainforests dominate. These differences in climate and terrain play a direct role in settlement patterns, agricultural productivity, infrastructure development, and long-term economic opportunity.
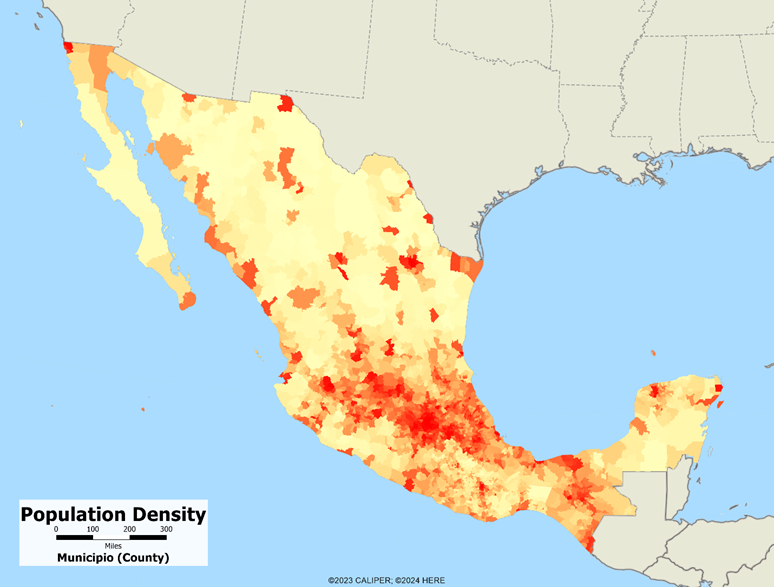
Mexico’s population is far from evenly distributed. National population density maps clearly show concentration along the central highlands, in major metro areas, and along select coastal regions. The Mexico City metro area alone represents one of the largest urban agglomerations in the world, while Guadalajara and Monterrey anchor additional high-density corridors.
In contrast, large portions of northern Mexico, mountainous regions, and parts of the south remain sparsely populated. These lower-density areas are often constrained by elevation, limited water access, or infrastructure challenges. Viewing population density at the municipio level—roughly equivalent to U.S. counties—reveals just how localized growth and settlement truly are.
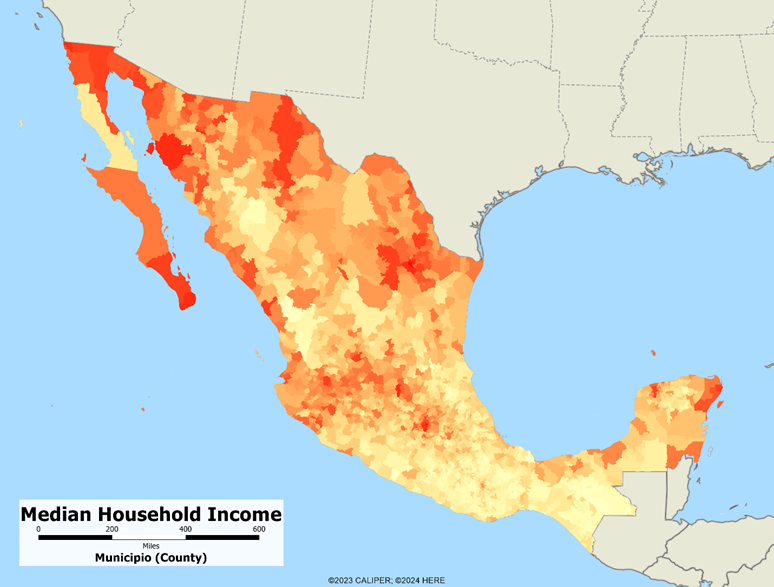
Economic activity in Mexico mirrors its physical and population geography. Median household income tends to be highest in major urban centers, in well-established tourism destinations, and across the manufacturing corridor of northern Mexico, stretching from Tijuana through Ciudad Juárez to Matamoros. These areas benefit from cross-border trade, industrial investment, and transportation infrastructure tied to the U.S. market.
Higher incomes are also evident along the Trans-Mexican Volcanic Belt, particularly around Mexico City and Guadalajara. In contrast, median incomes are generally lowest in the mountainous regions of the Sierra Madre Occidental and Sierra Madre del Sur, areas that also have higher shares of rural populations and limited access to services.
These income patterns are not random—they reflect centuries of geography-driven development and continue to shape modern economic outcomes.
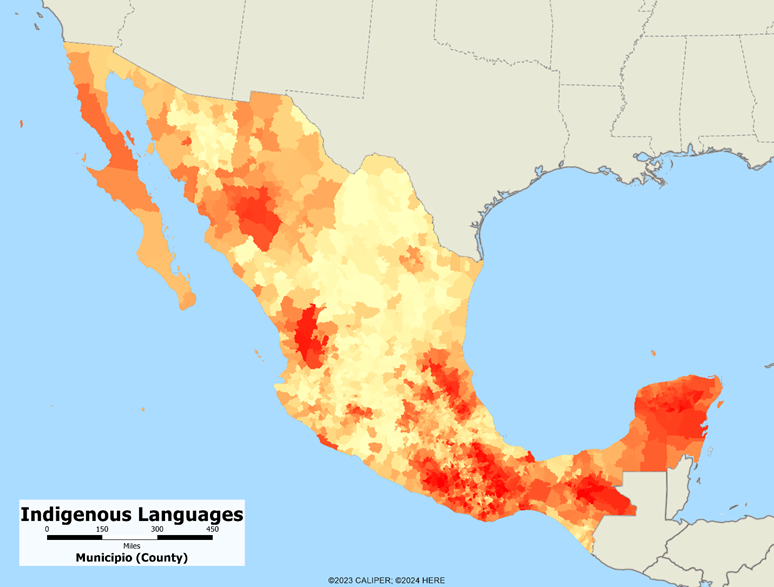
Mexico is one of the most linguistically and culturally diverse countries in the world. National maps of indigenous language speakers show strong concentrations in southern and mountainous regions, particularly in states such as Oaxaca, Chiapas, and Guerrero.
These patterns align closely with areas of rugged terrain that historically limited colonial settlement and preserved indigenous communities. Understanding where indigenous languages are spoken is essential for interpreting education outcomes, labor markets, household structure, and service access—and it adds critical context to income and infrastructure data.
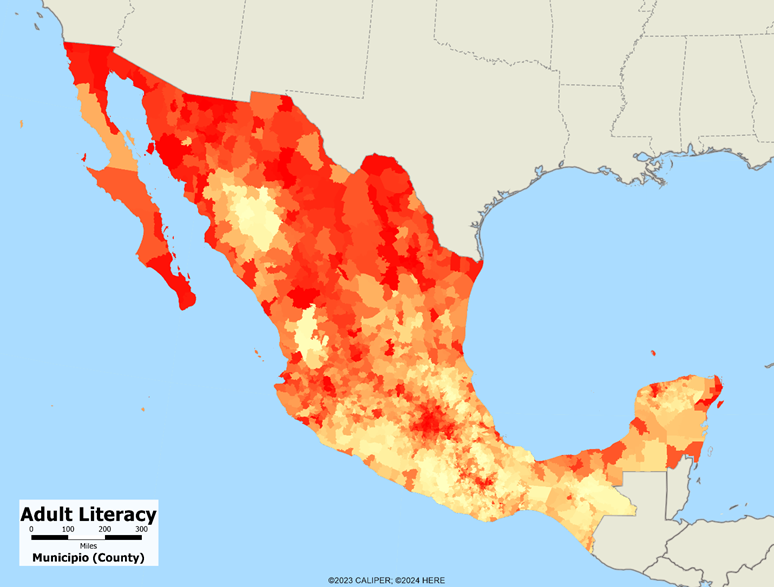
Adult literacy rates in Mexico generally track with urbanization and economic development. Higher literacy levels are found in major metro areas and industrial regions, while lower rates persist in rural, mountainous, and indigenous-majority areas.
These disparities highlight how geography, infrastructure, and historical investment intersect. Literacy is not just an education metric—it is deeply connected to workforce participation, income potential, and long-term regional growth.
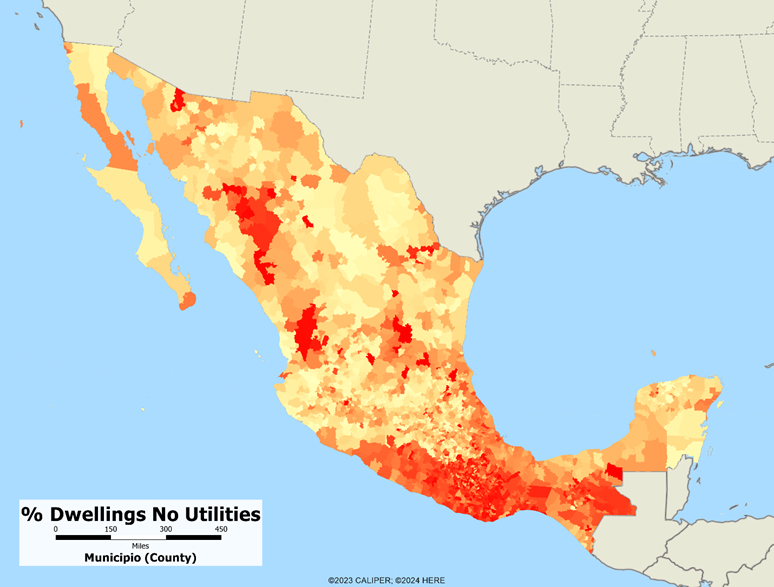
One of the most telling indicators of regional inequality is access to basic household utilities. National maps showing the percentage of dwellings without full utility access reveal stark contrasts between urban centers and more remote regions.
Areas with higher shares of homes lacking water, electricity, or sanitation tend to overlap with low-income, rural, and indigenous regions. These patterns are critical for anyone analyzing housing markets, infrastructure needs, public health, or economic development opportunities.
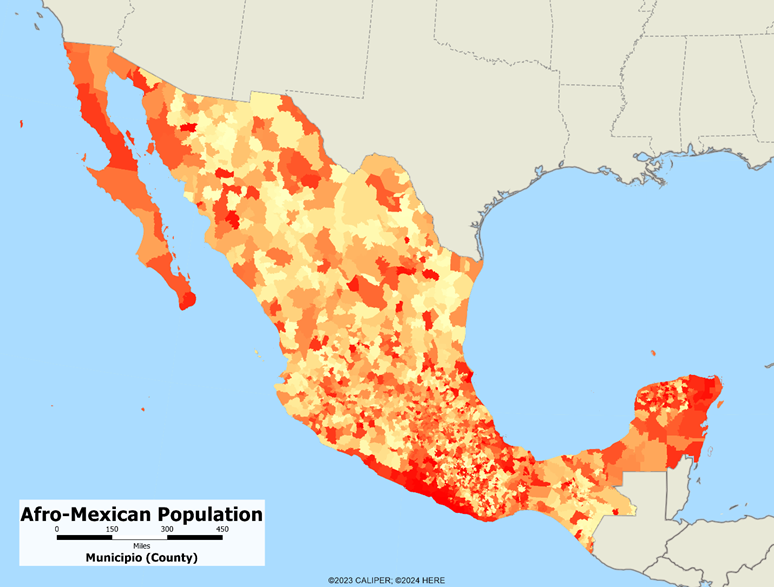
Often overlooked in national conversations, Mexico’s Afro-Mexican population has a distinct geographic footprint. Concentrations are most visible along parts of the Pacific coast, particularly in states such as Guerrero and Oaxaca, reflecting historical settlement tied to trade routes and colonial-era labor systems.
Including Afro-Mexican population data adds an important layer to understanding Mexico’s demographic and cultural complexity and ensures a more complete picture of the country’s population.
Mexico’s geography shapes everything—from where people live and work to how wealth, education, and infrastructure are distributed. National-level maps provide essential context, but they are only the beginning.
In the coming posts, we will dive state by state, exploring how these national patterns play out locally—and how detailed, municipio-level data helps uncover opportunities and challenges that are invisible at broader scales.
Understanding Mexico starts with geography. From there, the data tells the story.