
If you are feeling the squeeze in your budget from rising childcare costs, you aren’t alone. This year, parents are reporting increases in childcare costs, which have been on the rise since 2020. According to a study done by Care.com, respondents spend 24% of their household income on childcare, despite the U.S. Department of Health and Human Services considering spending no more than 7% of their household income on childcare. Where are childcare services least expensive, and where do they take up the highest percentage of the median household income?
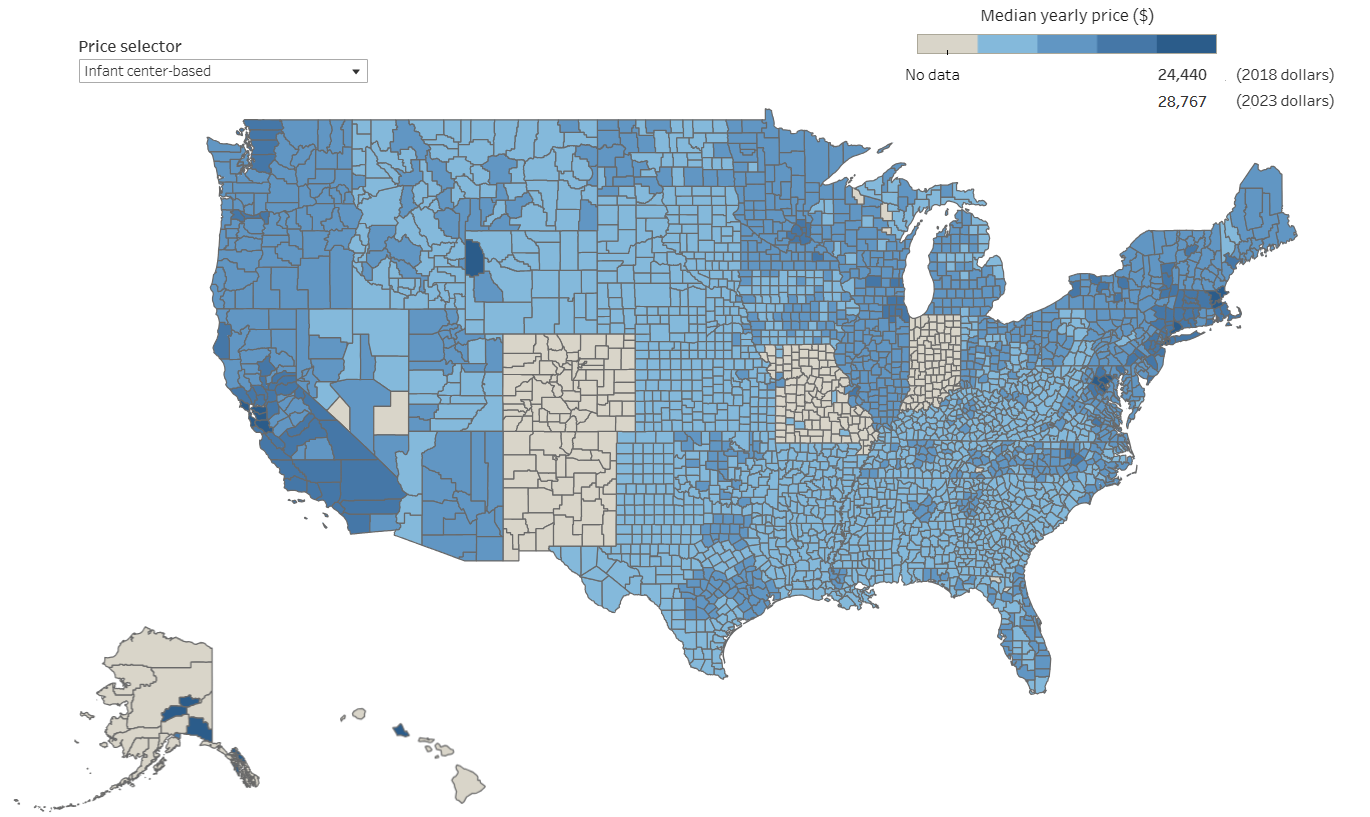
Before we get to the maps, it is important to understand the costs of childcare. For this article, we are getting our data and maps from the U.S. Department of Labor Women’s Bureau. According to their research, in 2018, median childcare prices for one child ranged from $4,810 ($5,357 in 2022 dollars) to $15,417 ($17,171 in 2022 dollars) depending on provider type, children’s age, and county population size. Infant childcare is the most expensive, and childcare for school aged children the least expensive. Most households are paying for more than one child, meaning that the compounding childcare costs can be burdensome for some households. According to the Department of Labor, infant based childcare for one child in a childcare center represents nearly 20% of the household income for counties with more than 1,000,000 people. In 2018, 29% of families with a child under 6 years of age had two or more children in that age group, adding to the costs.
Since infant center-based care is the most expensive of all childcare options, we used it for all examples. Unfortunately, not every county submitted for the market rate survey done by the Department of Labor, including all of New Mexico, Colorado, Indiana, and much of Alaska, Hawaii and Missouri. When looking at childcare prices alone, the coasts have more expensive childcare than the middle of the country, and notably, California’s bay area, Southern California, the D.C. metro, Boston metro and NYC metro all have significant infant childcare costs, all above $15,000 a year. Outliers include Teton County, Wyoming, where infant childcare runs you over $24,000 a year, more than 18% of the median family income. Those counties that reported in Hawaii and Alaska show costs above $20,000 a year. The map below is a screenshot of an interactive map which can be found here.
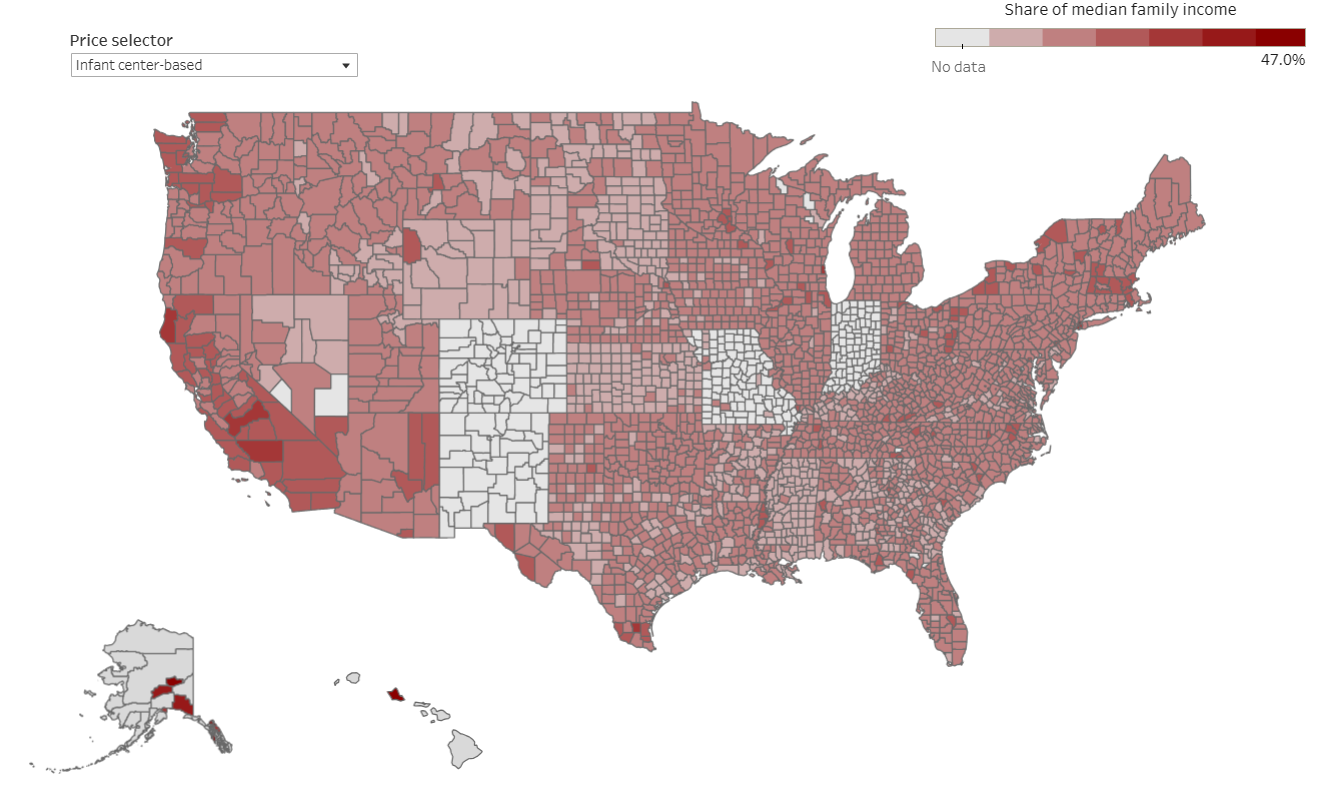
When you breakdown the affordability of childcare, one child in infant center-based daycare can account for more than 25% of a family’s income in some areas. The map below shows childcare prices as a share of median family income, which closely follows the previous map with some outliers. Many of the major metro areas previously discussed as having high costs don’t necessarily have the highest percentage of family income spent on childcare, as those areas are more affluent. However, some new areas emerge when you look at affordability. In Apache County in Eastern Arizona, where median family income is about $41,000 a year and 28.2% of families live in poverty, childcare prices are 22.3% of the median income. Similarly, Brooks County, Texas, shows childcare prices as nearly 27% of the median family income of about $29,000 per year, with 33% of the families in the county living in poverty. The map below is a screenshot of an interactive map which can be found here.
If you are interested in learning more and seeing the data and reports, head here.

Recent Comments