
In many articles on the census disclosure avoidance program, we have hammered away at the damage inflicted on the 2020 census by a well-intentioned but overly complex and likely poorly implemented attempt at maintaining privacy. We published maps and tables, coined names for the worst cases, and published links to scholarly articles which show that privacy wasn’t achieved in any event.
There are no more than five companies providing small area demographic estimates and projections in the United States, and it is instructive to review the radically different approaches taken to identify and communicate them to users, and more importantly, mitigating the effects of these deliberate errors in the census data. While AGS has been busy informing and correcting, what have they been up to?
One initially made the highly amusing claim that they had a “special relationship” with the census and these problems simply didn’t apply to them. Having recently broken a decades old pattern of annual releases with an unexplained ‘early’ release of this year’s data likely means that they discovered they weren’t so special after all.
Another said that AGS was being overly dramatic, but have finally admitted that yes, there are statistical and logical impossibilities in the data that need correction. But they persist in assuring us that these are but minor bumps on the road to data nirvana.
A third claims that the Census Bureau data is to be trusted as reported and as the “ultimate truth” to create their models for the decade ahead. Rather than alerting clients to the issues and attempting to repair them, they proudly proclaimed being first to release the DHC, presumably as delivered.
The fourth? Crickets.
Well, so what? The census data is now nearly four years out of date and most users will rely on current year estimates rather than ageing census data. But much of this flawed census data will become critical in analyzing trends in some key tables – age by sex, race and Hispanic origin, household size, and family structure to name a few. If the published tables are used as the “baseline”, the results will increasingly diverge from reality because of the spatial patterns of noise injection used by the Census Bureau. The smaller the value, the greater the percent deviation in it at the local level, since values are pushed to zero or to large enough values to prevent disclosure. Using ‘lumpy’ data as the basis for projections will result in the apparent polarization of demographics over time.
Last week we covered the errors introduced into the household by size table, which showed that half of the counties had tables which were not possible given the population in household count. Barnstable County, MA was the largest of these ‘impossibilities’, so we thought that we would show the block level data:
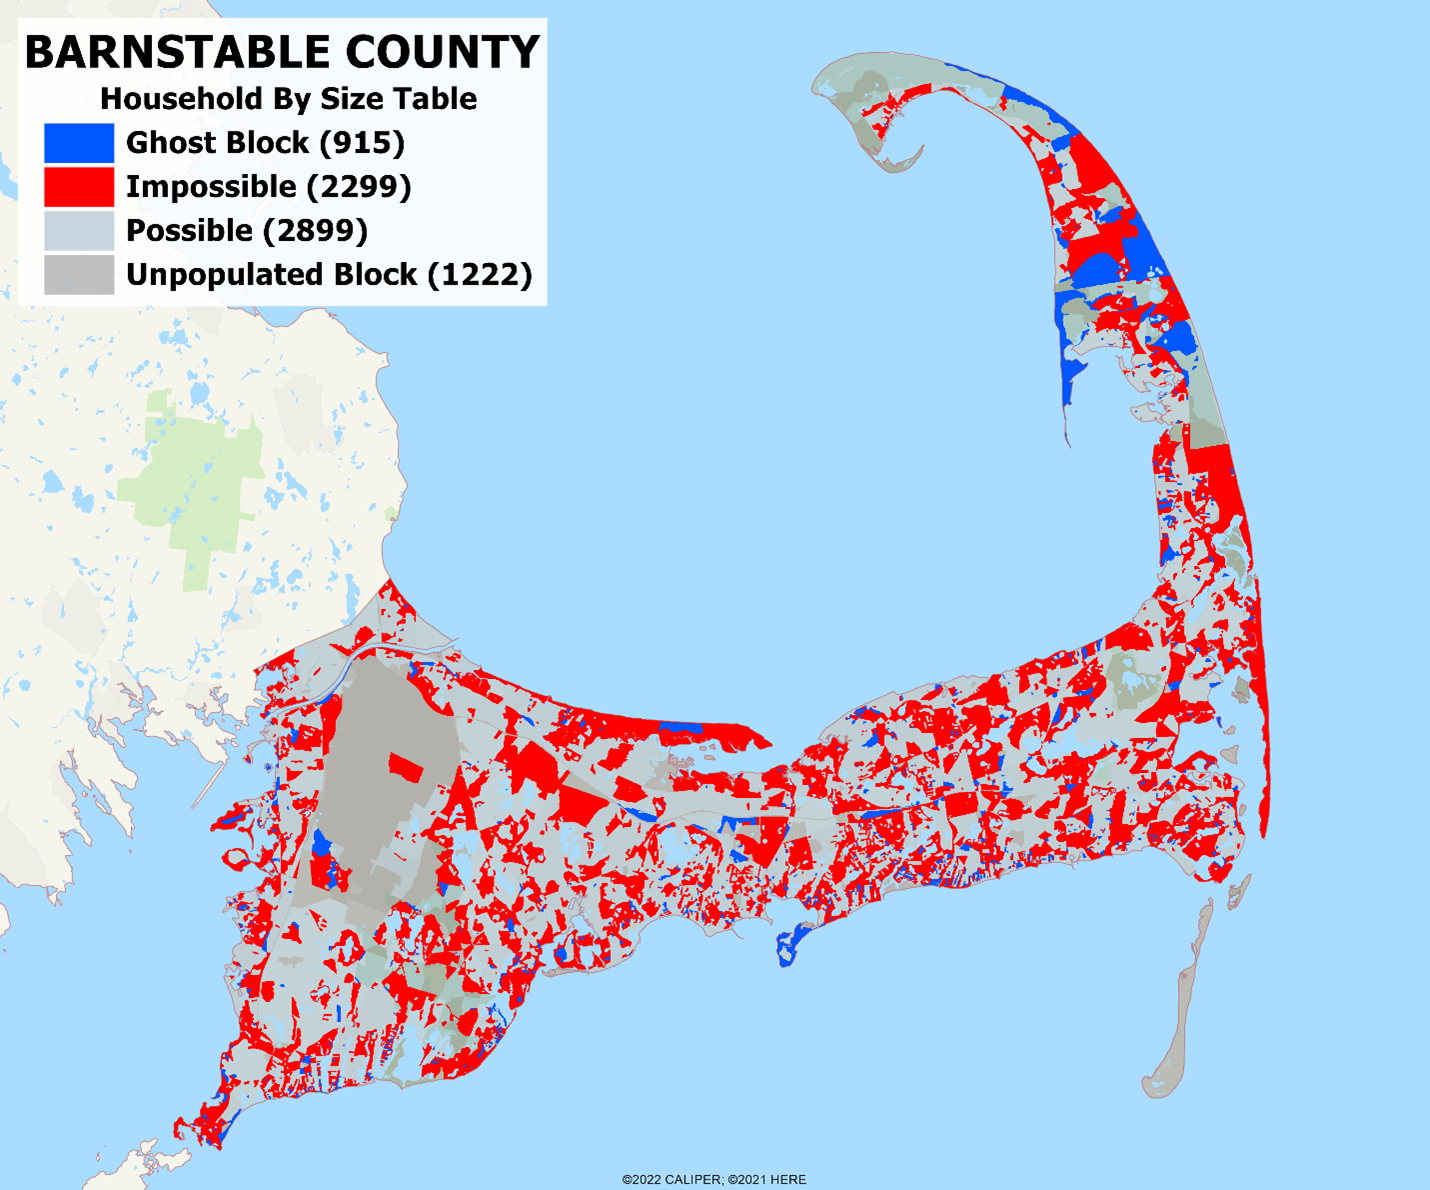
There are 7,335 blocks in the county, of which 1,222 are unpopulated. Of the populated blocks, a whopping 915 are ghost blocks – that is, persons in households with zero households existing in the block – and only 47.4% of the populated blocks have data which is statistically possible! Ultimate truth? We think not.
The world has been increasingly embracing the value of geospatial data, and there are numerous applications popping up recently discovered geospatial data across a wide range of vertical markets. Many of these are naively using the free ‘as is’ data from the census. These applications will prove unsatisfactory to knowledgeable users who will insist on quality current year estimates. If you are a user of these applications, you should insist on having the option to subscribe to a quality estimates and projections program.
The demographics firms which have ignored or minimized the problems we have identified will encounter growing plausibility issues in their estimates and projections over the coming years. If your provider has neither acknowledged nor addressed these issues, we submit that it is time to consider the one alternative who has done both.

Recent Comments