
A few weeks ago, we looked at the male/female ratio of 21-year-olds at the block group level to highlight the issues in the 2020 census data. Some readers pointed out that while this was interesting, most of their analyses are for radius or drive time areas, and surely these discrepancies would even out over multiple block groups. Fair statement.
So, let’s zoom out to the county level, where we would expect much more stability. This time we considered households by size, primarily because this table comes with a simple internal consistency check. If you assume that the 7+ person households are all 7 people, you can calculate the population in households by computing the cross-product of the household size and count of households in each category. This must be equal to or lower than the actual count of persons in households (obviously excluding population in group quarters). Below are the household counts by size of household for Barnstable County, MA (25001):
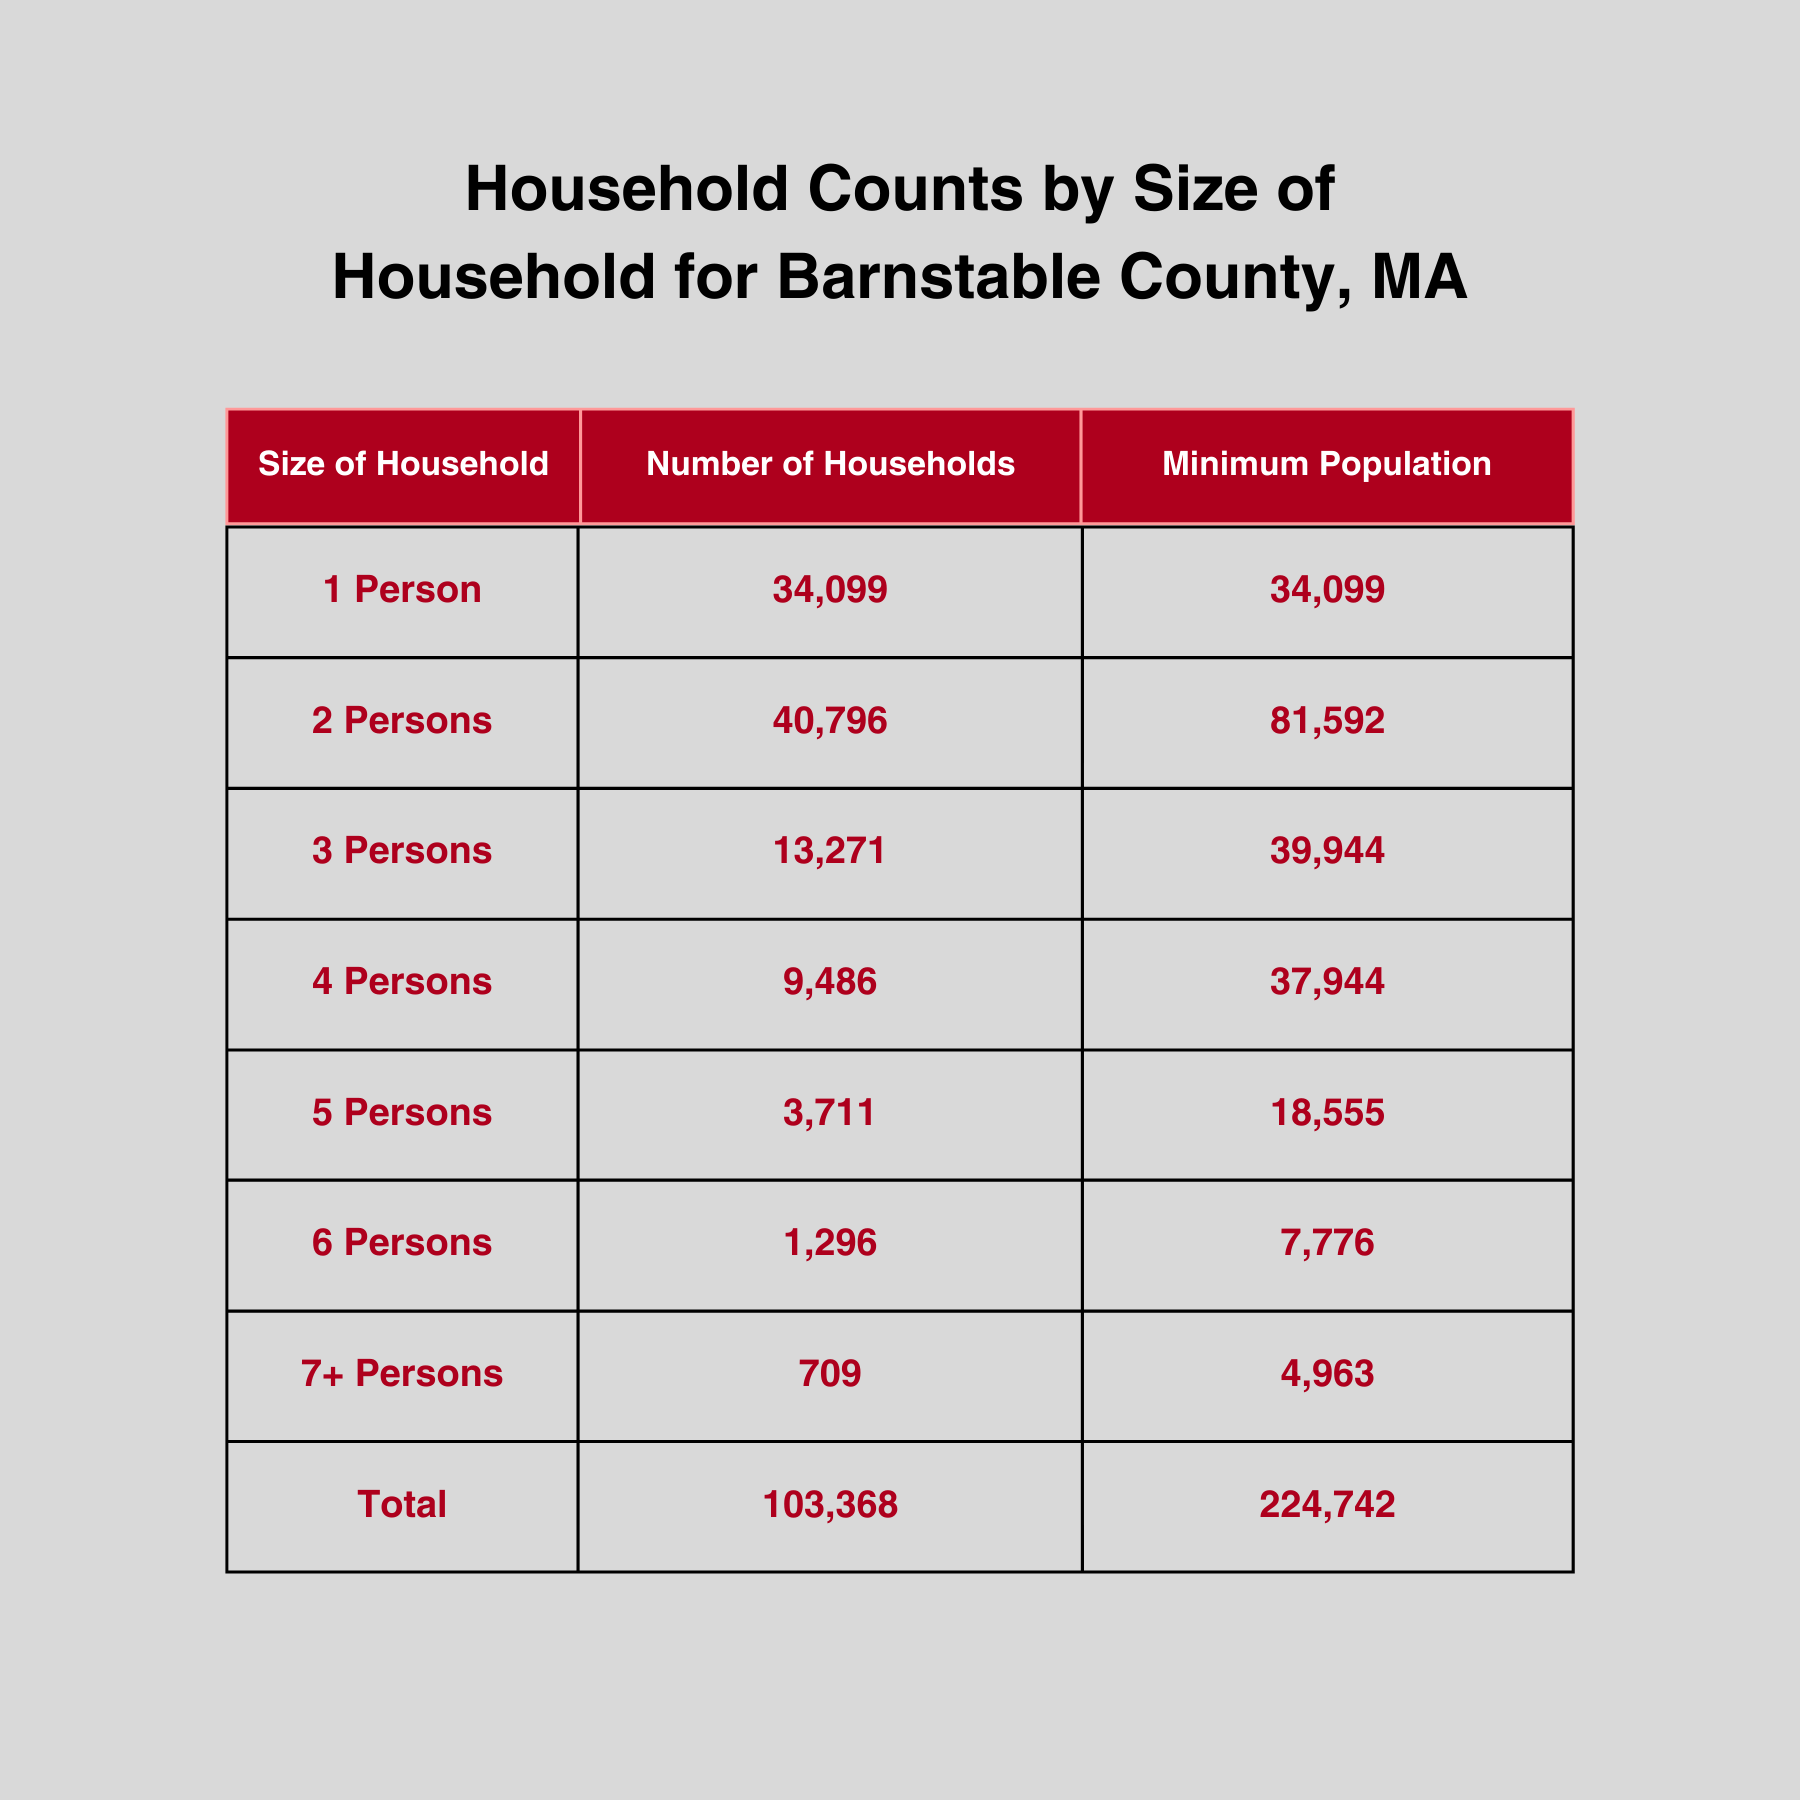
The problem is that the published data for population in households is 224,573 when the mathematics require a population which is slightly larger at 224,742. The only category in which there are degrees of freedom is the 7+ person category, which cannot be, by definition, below 7.0. In this case, the computed average persons per household in households with 7+ persons is 6.76, which is clearly not possible. But, you say, this is a small error. Who cares?
Over half the counties nationwide, including virtually all small counties, have impossible tabulations of households by size in the published data. At the block or block group level, the instability in the one table is extreme.
The interpretation of trends under these conditions becomes very difficult, as the magnitude of the injected noise will often exceed the degree of actual change, especially for small areas. For creating current estimates, it is always useful to have a ‘baseline’ figure (usually the decennial census year), but if this figure is unreliable, the impacts on trend analysis will become increasingly noticeable over the course of the decade.
What can we do about it?
We have been diligently using our proprietary matrix balancing algorithms developed over the last several decades to ensure that data from the block to the state level are consistent between geographic scales within the nested hierarchy. Does it guarantee accuracy? No, but it certainly is a significant improvement to what the census bureau has released, and it makes for a stable, usable, and plausible census block dataset for modeling purposes.
How much did the table change for Barnstable County? Here is the before and after:
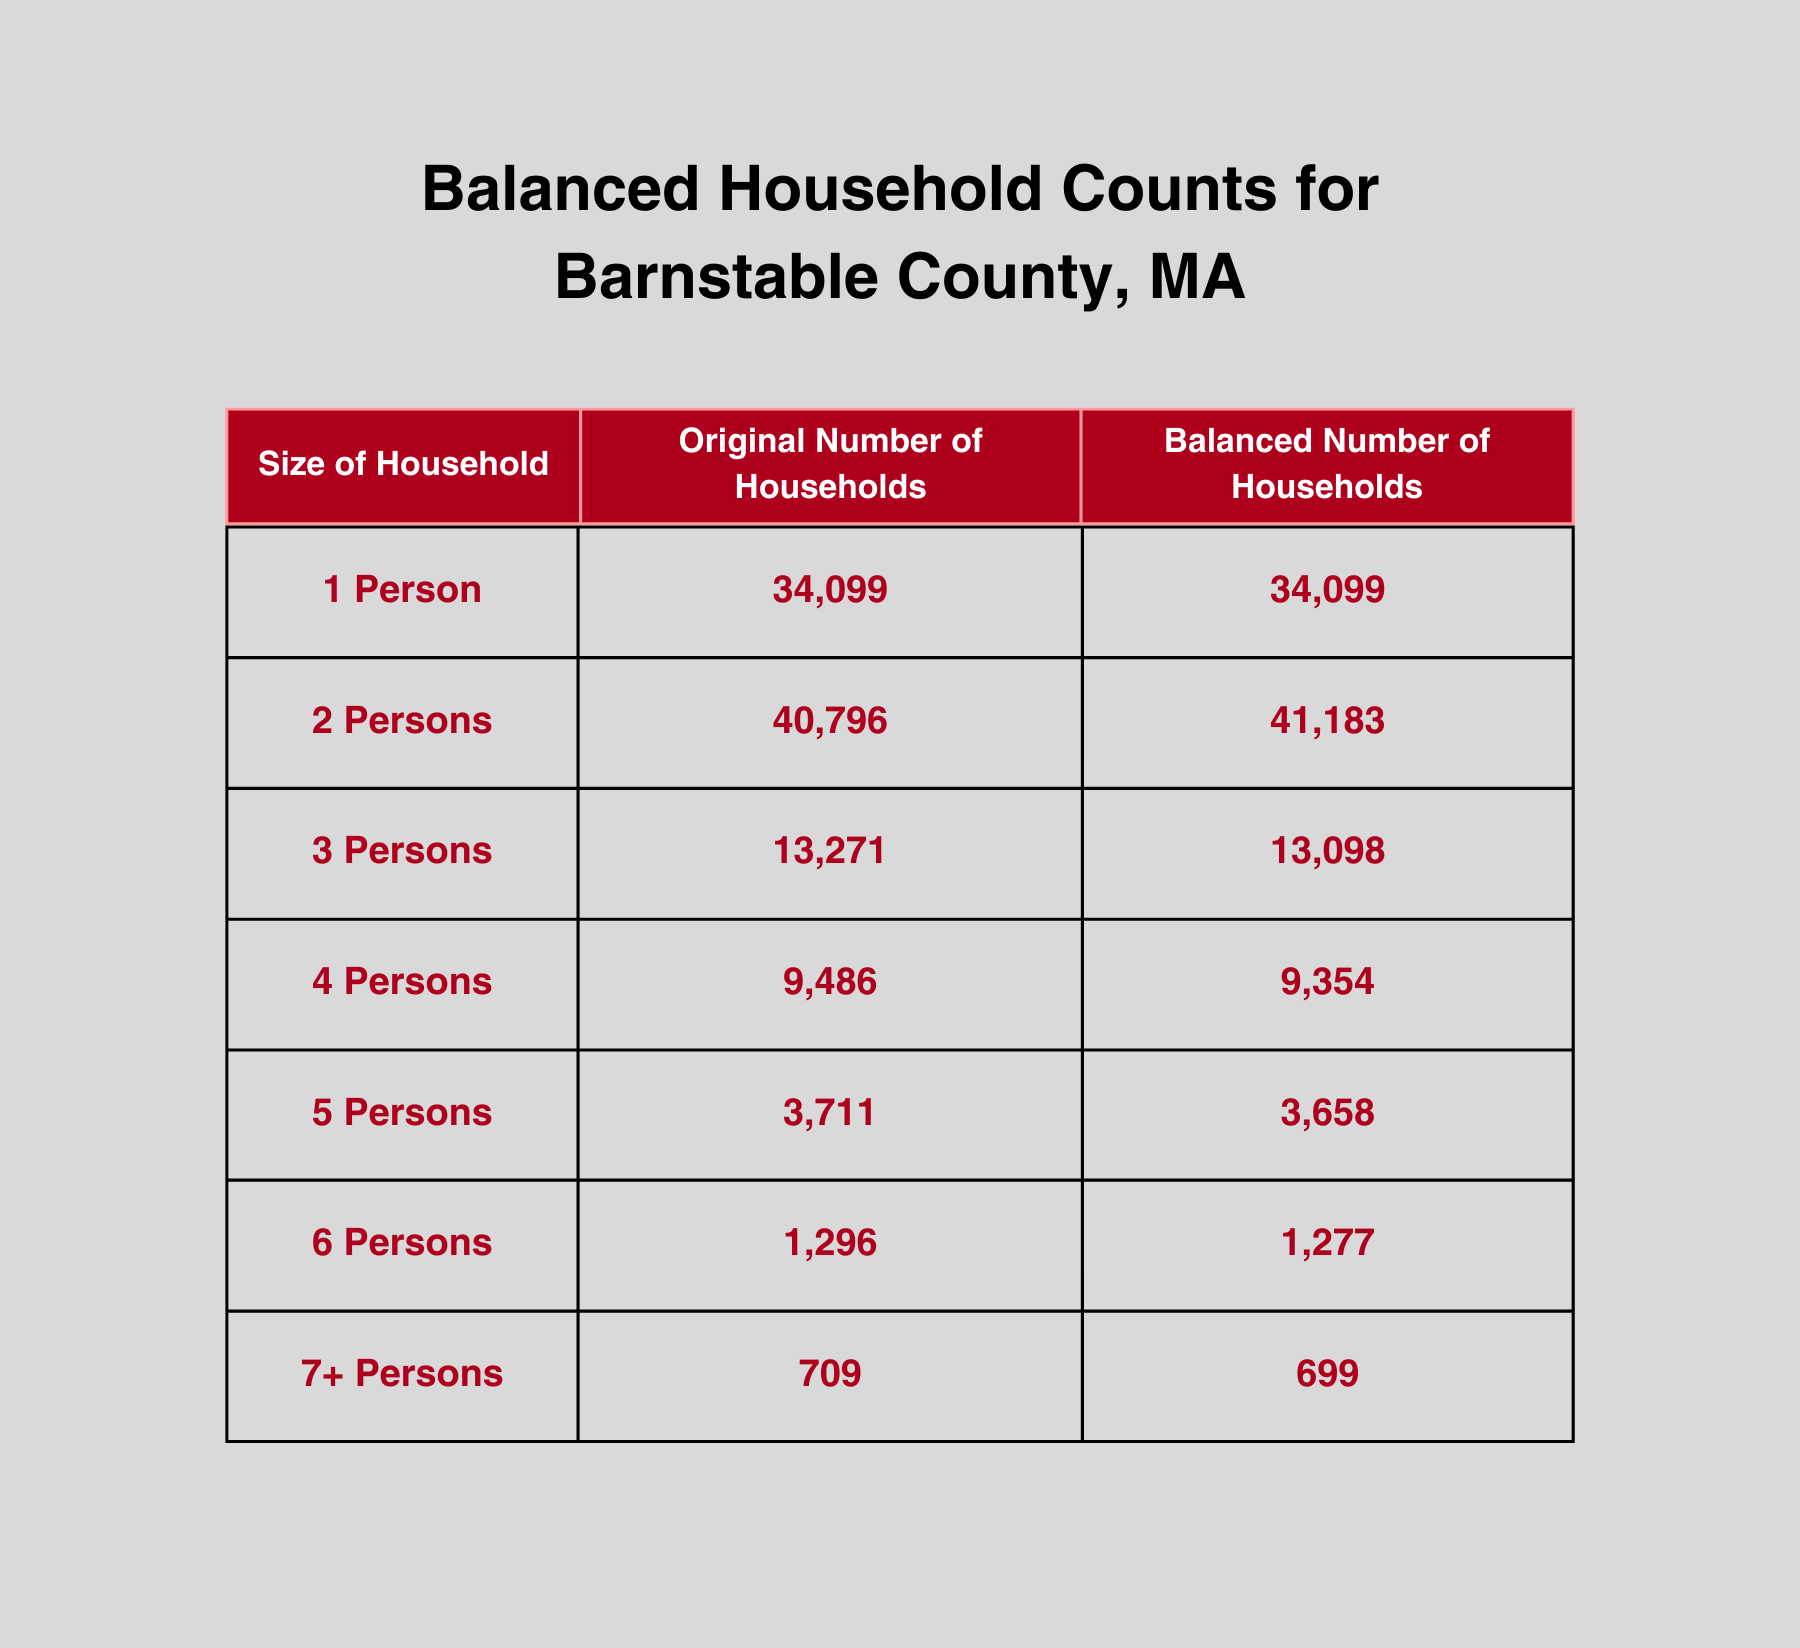
These subtle yet important corrections can have a major impact on our ability to use the block and block group data as a starting point for the decade’s estimates and projections.
Stay tuned, as our next discussion will be on the cumulative effects of using uncorrected census data for time series comparisons and projections.

Recent Comments