
The share of total employment in the United States accounted for by government agencies (both national and local) has grown substantially since the beginning of World War II. In 1948, governments employed about 4.5 million workers – or 7.5% of the labor force (St. Louis Fed, FRED series). Today, Governments employ 22.7 million workers – nearly 17.5% of the total employment.
As government employment grew over the decades, one of the concerns was that employment was being concentrated in both state and the federal capital. Public sector employment is traditionally more immune to macroeconomic cycles, wages are typically higher than equivalent public sector positions, and many smaller communities benefit substantially from this stability.
One of the goals of the federal government over recent decades has been to decentralize its operations to support regional economic growth. For example, the Bureau of Land Management moved the bulk of its day-to-day operations to Denver some years ago, albeit with mixed results as many of the top officials simply found positions in other agencies rather than move from Washington.
We looked at employment change between 1990 and 2023 by level of government to see how these decentralization efforts have played out spatially. We used ten-mile radius areas for each block group on the map to smooth out local variance to focus on the broader picture.
First, the overall picture:
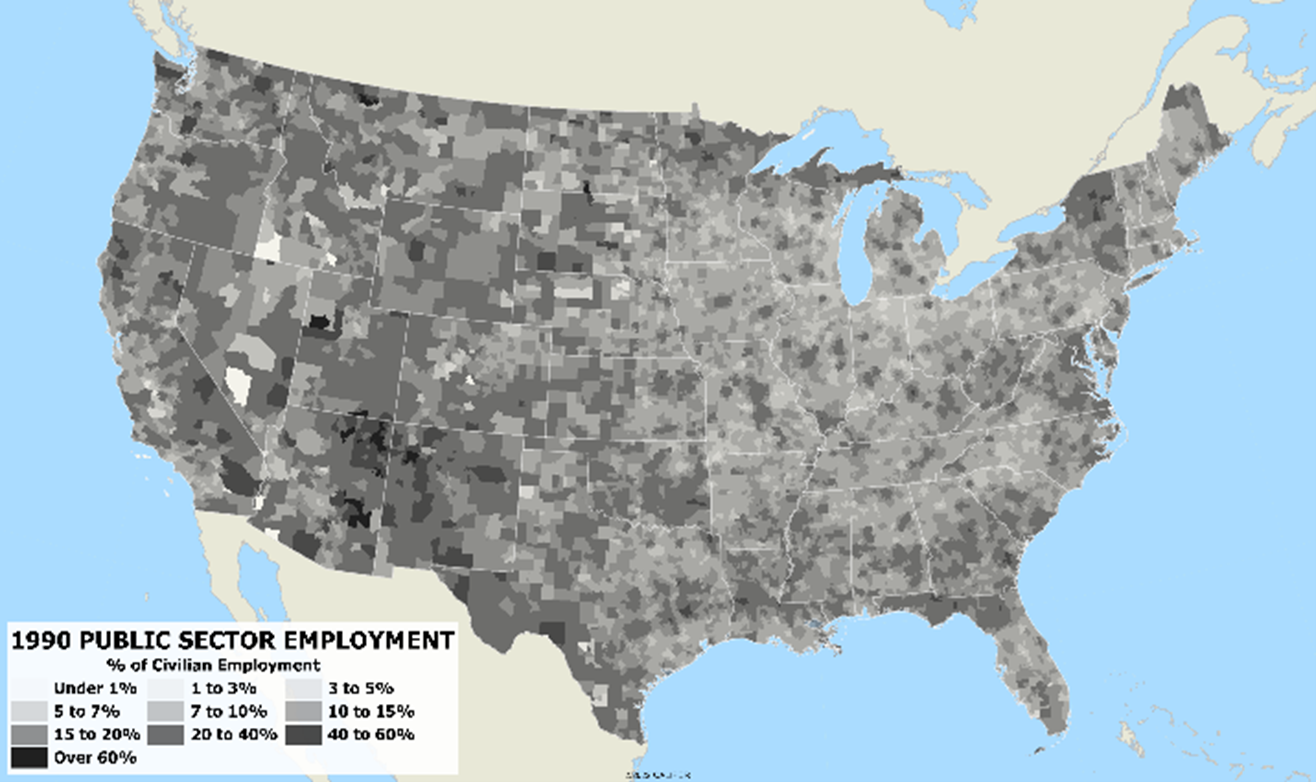
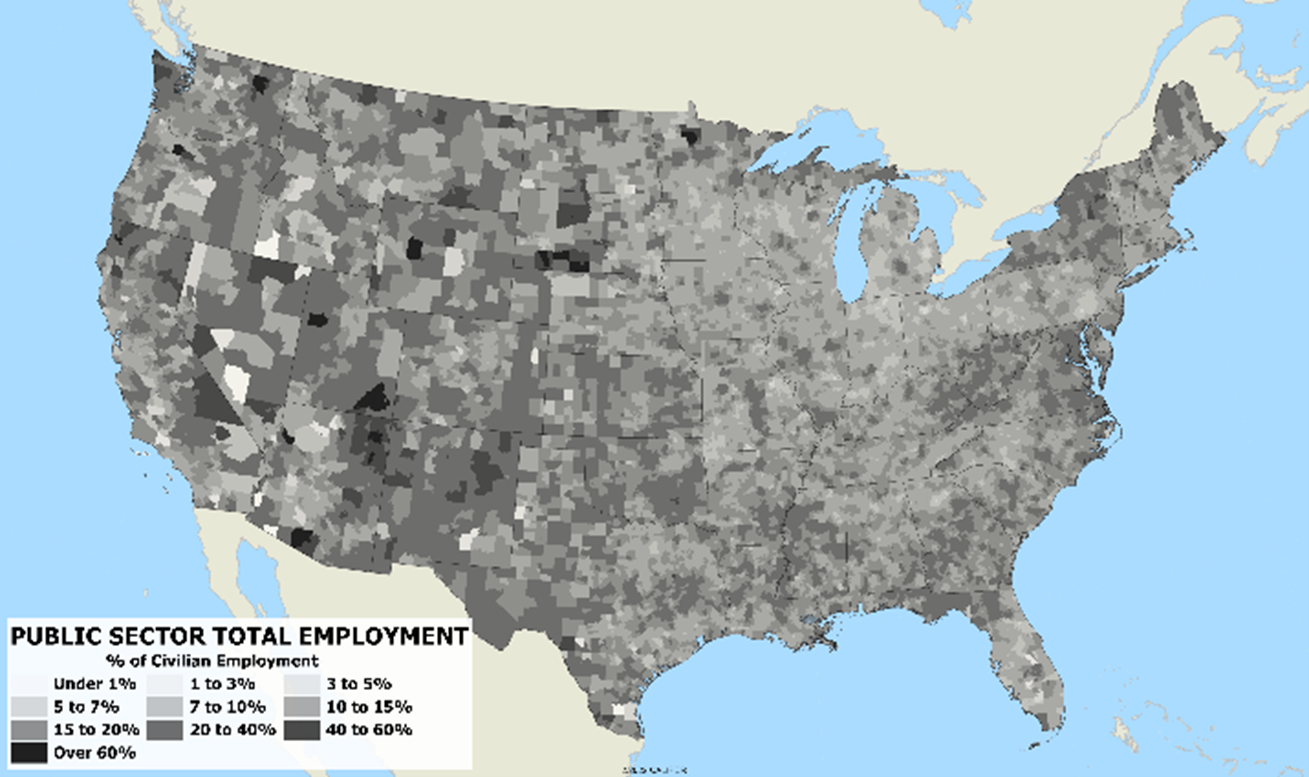
Clearly, employment as a percentage of the total has continued to grow over the past three decades, but the general spatial patterns have remained consistent – the areas of high concentration in 1990 remain such today.
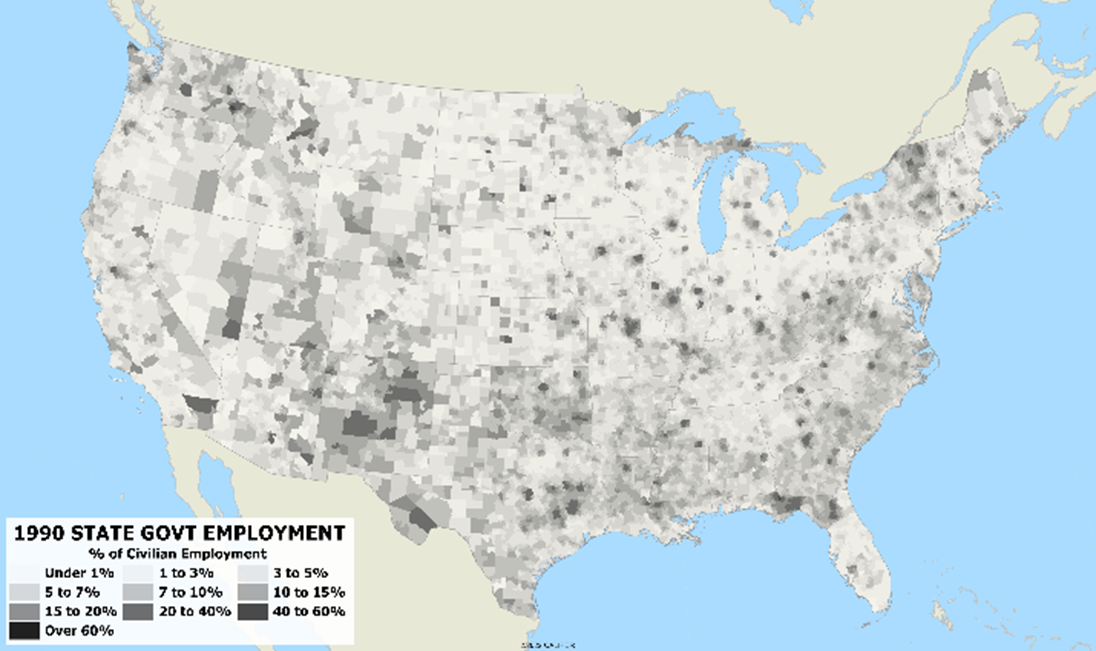
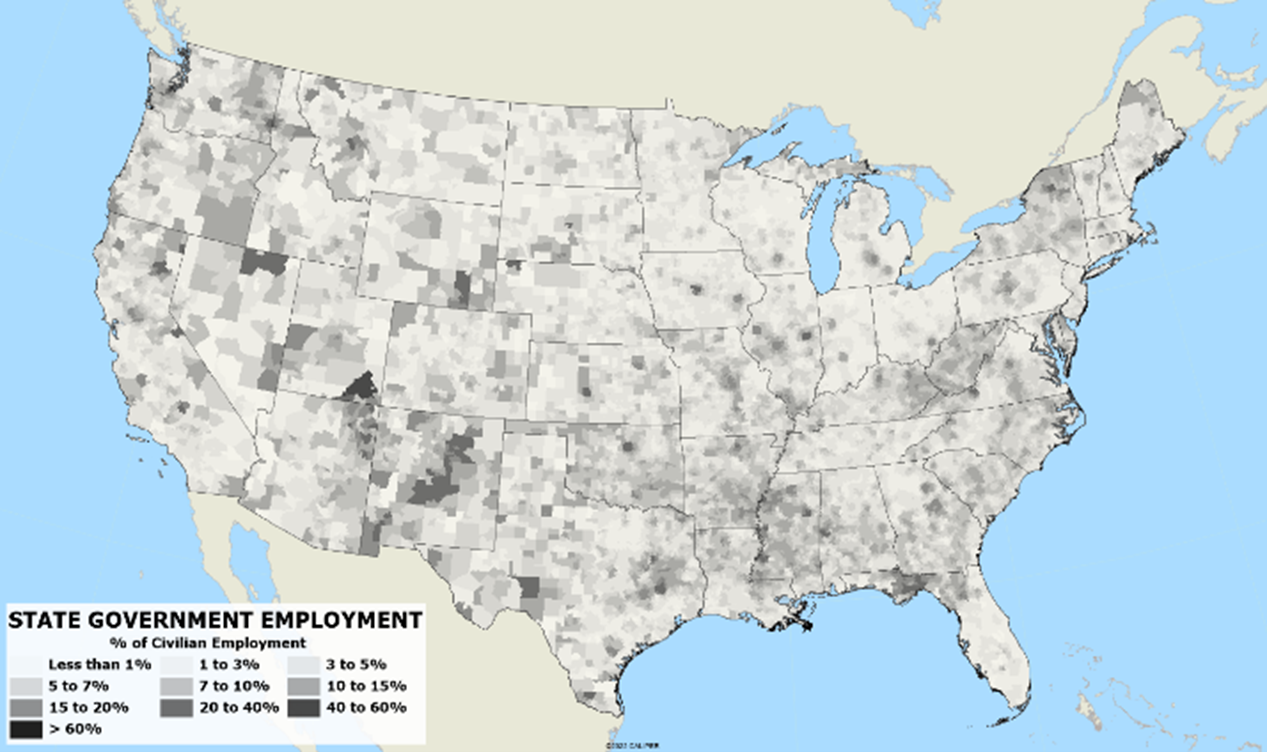
At a state level, the maps clearly show the preeminence of the capital city in most states, but general levels of employment differ substantially (such as Pennsylvania/New York or Kentucky/Tennessee). In some states, like West Virginia, employment is distributed across the state; but in Florida, the preeminence of Tallahassee is clearly seen.
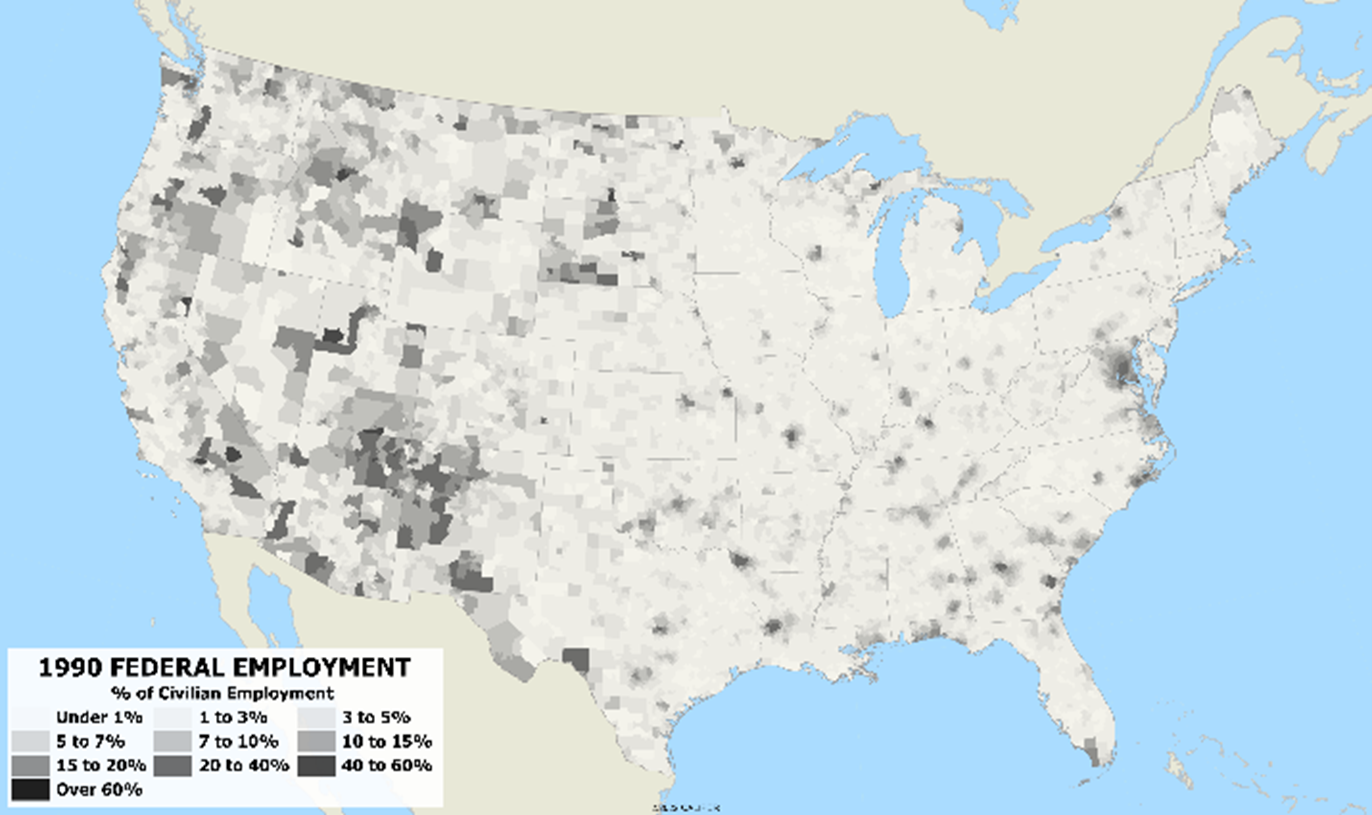
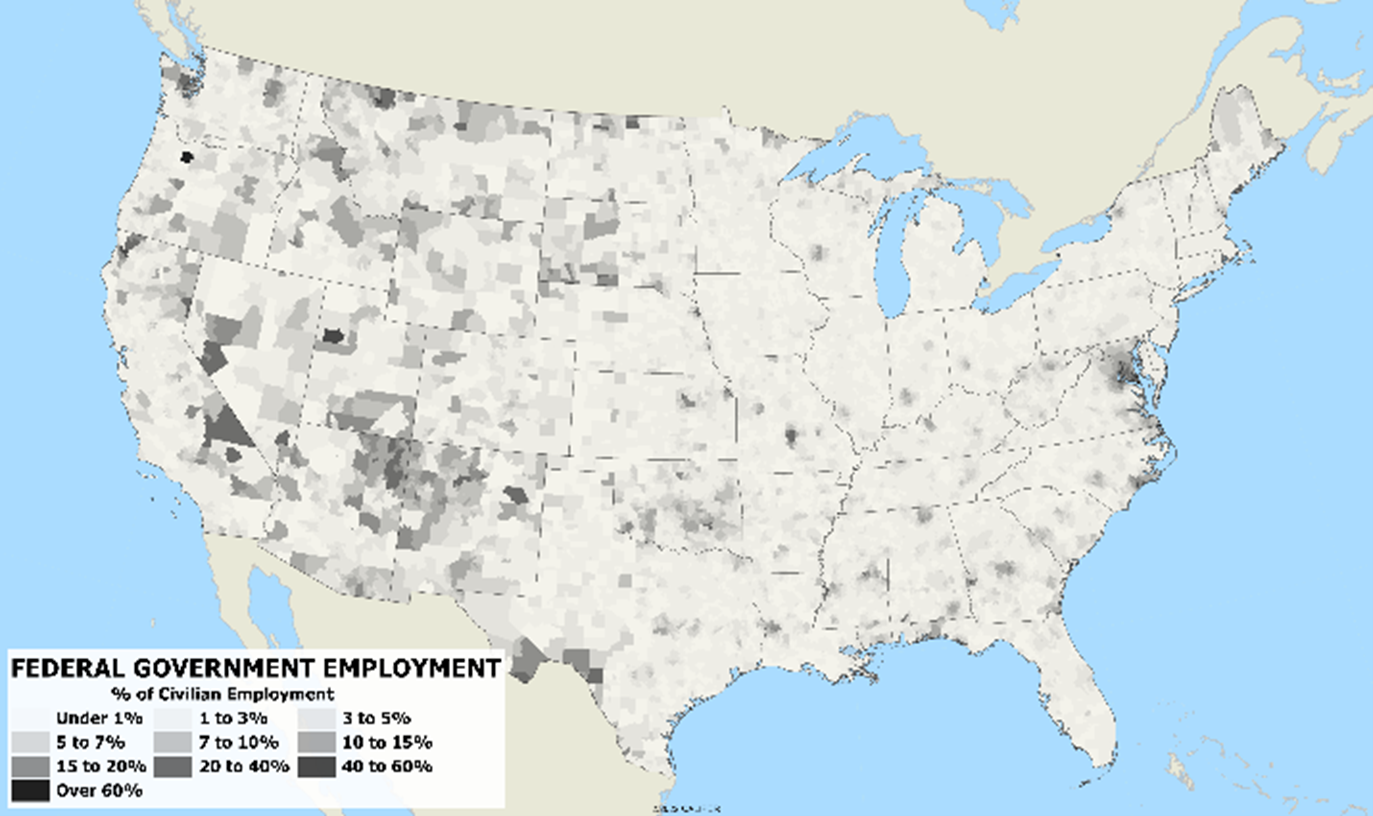
Federal employment is highest in Washington DC, of course, but also in the western states because of the management of federal lands and the Bureau of Indian Affairs. The decentralization efforts of the federal government are not particularly apparent on the maps below:
The temporal analysis of geographic data is usually limited to large scale areas which are stable, and most studies concentrate on the state level to avoid boundary change issues. With each decennial census, AGS has re-estimated its historical databases on the current boundaries, which provides a consistent geographic base for time series analysis. The detailed data dates from the 1990 census, with selected overview and key variables for 1970 and 1980.

Recent Comments