As many of you know, after many delays the Census Bureau finally released the DHC (Demographic and Housing Characteristics) file at the end of May. This eagerly anticipated set of files includes many essential core tables, such as population by age and sex, race by Hispanic origin, and household structure.
We recently cautioned users against using the release without thorough analysis and modification, since the same procedures for disclosure avoidance (DA) were used as for the 2021 PL-94. Those DA techniques result in serious issues for demographic modeling and projections for small geographic areas, as has been well documented by AGS. While most of our colleagues were initially silent on the issue, we sought to ensure that the user community was fully informed about the obvious inconsistencies at the block and block group levels that were being injected into the data. At the same time, we were developing sophisticated techniques aimed at mitigation in order to provide consistent and plausible data.
Recall that in the PL-94 release, the Census advised that even the computation of average household size was not advisable as it would yield significant error for small areas. For the DHC, the problem is compounded exponentially. If two key variables – population in households and households – could not be represented at the block group level without substantial modification, imagine the error within a table of age by sex which AGS typically represents as a 34×2 matrix.
The smaller the value of a cell, the greater the noise injection. The result is that DA procedures result in a ‘lumpiness’ in these tables. As is, the data is unsuitable for use in demographic estimation models and will cause their results to become exponentially more inaccurate.
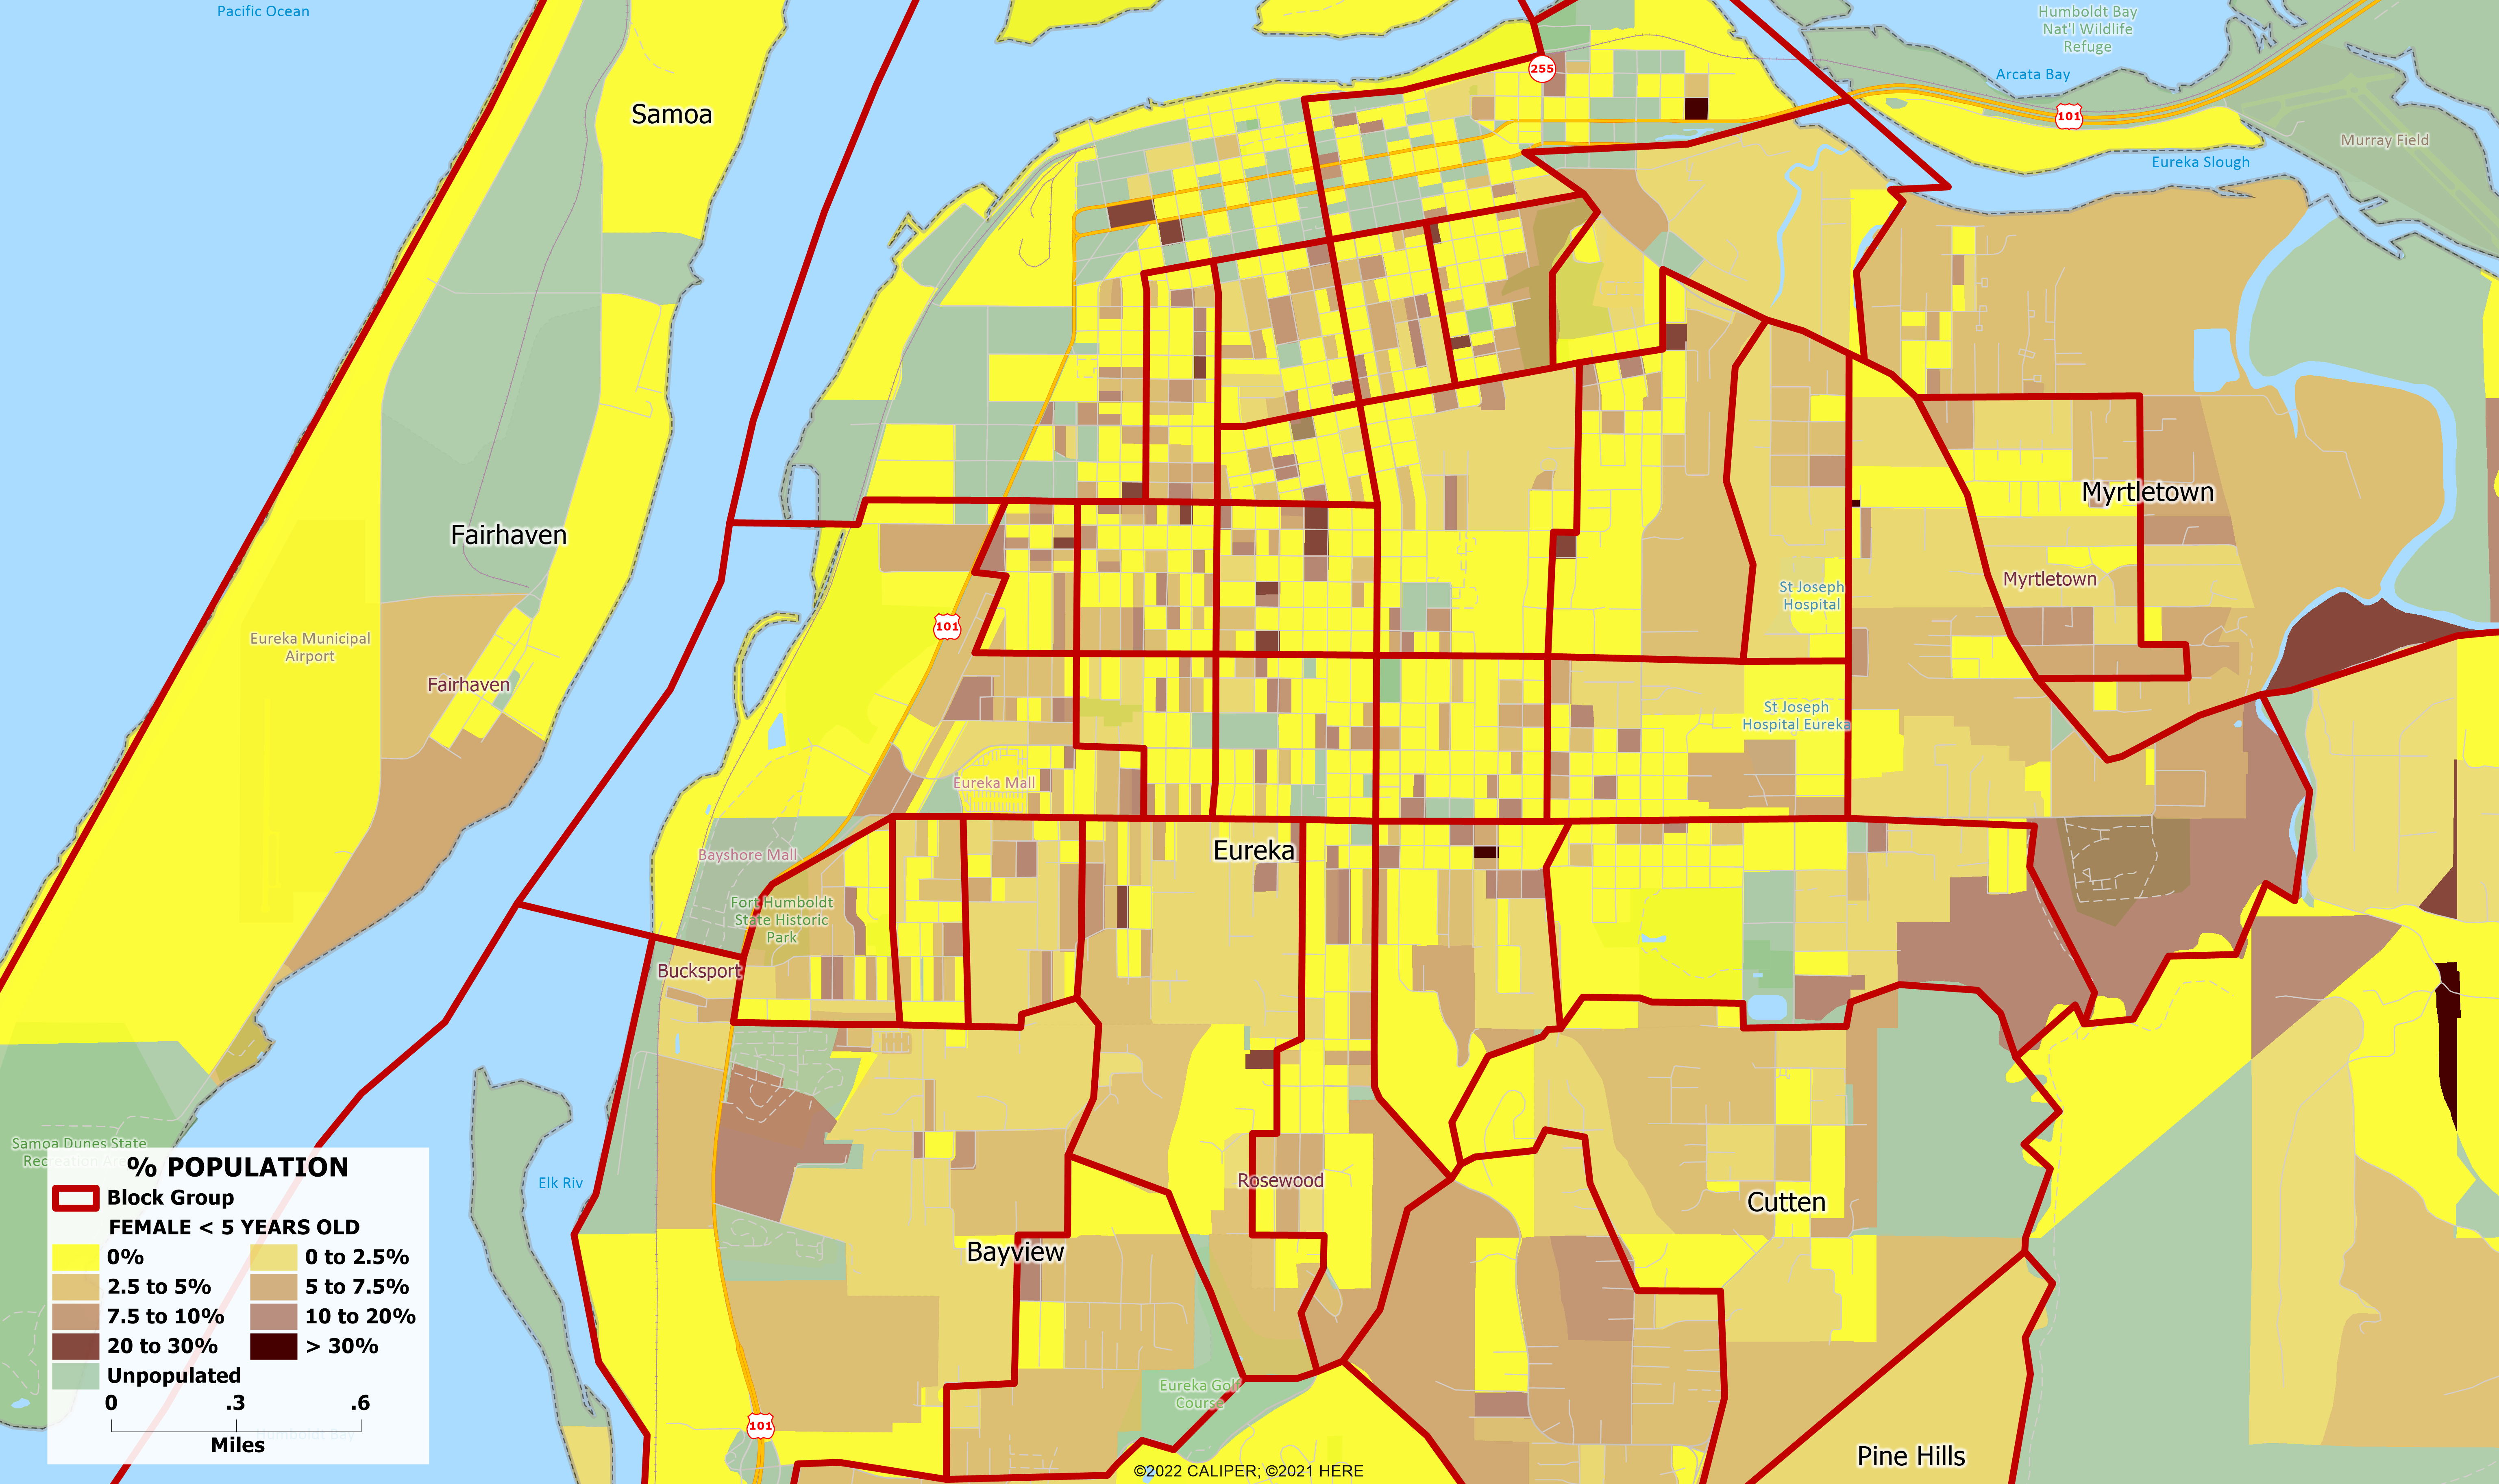
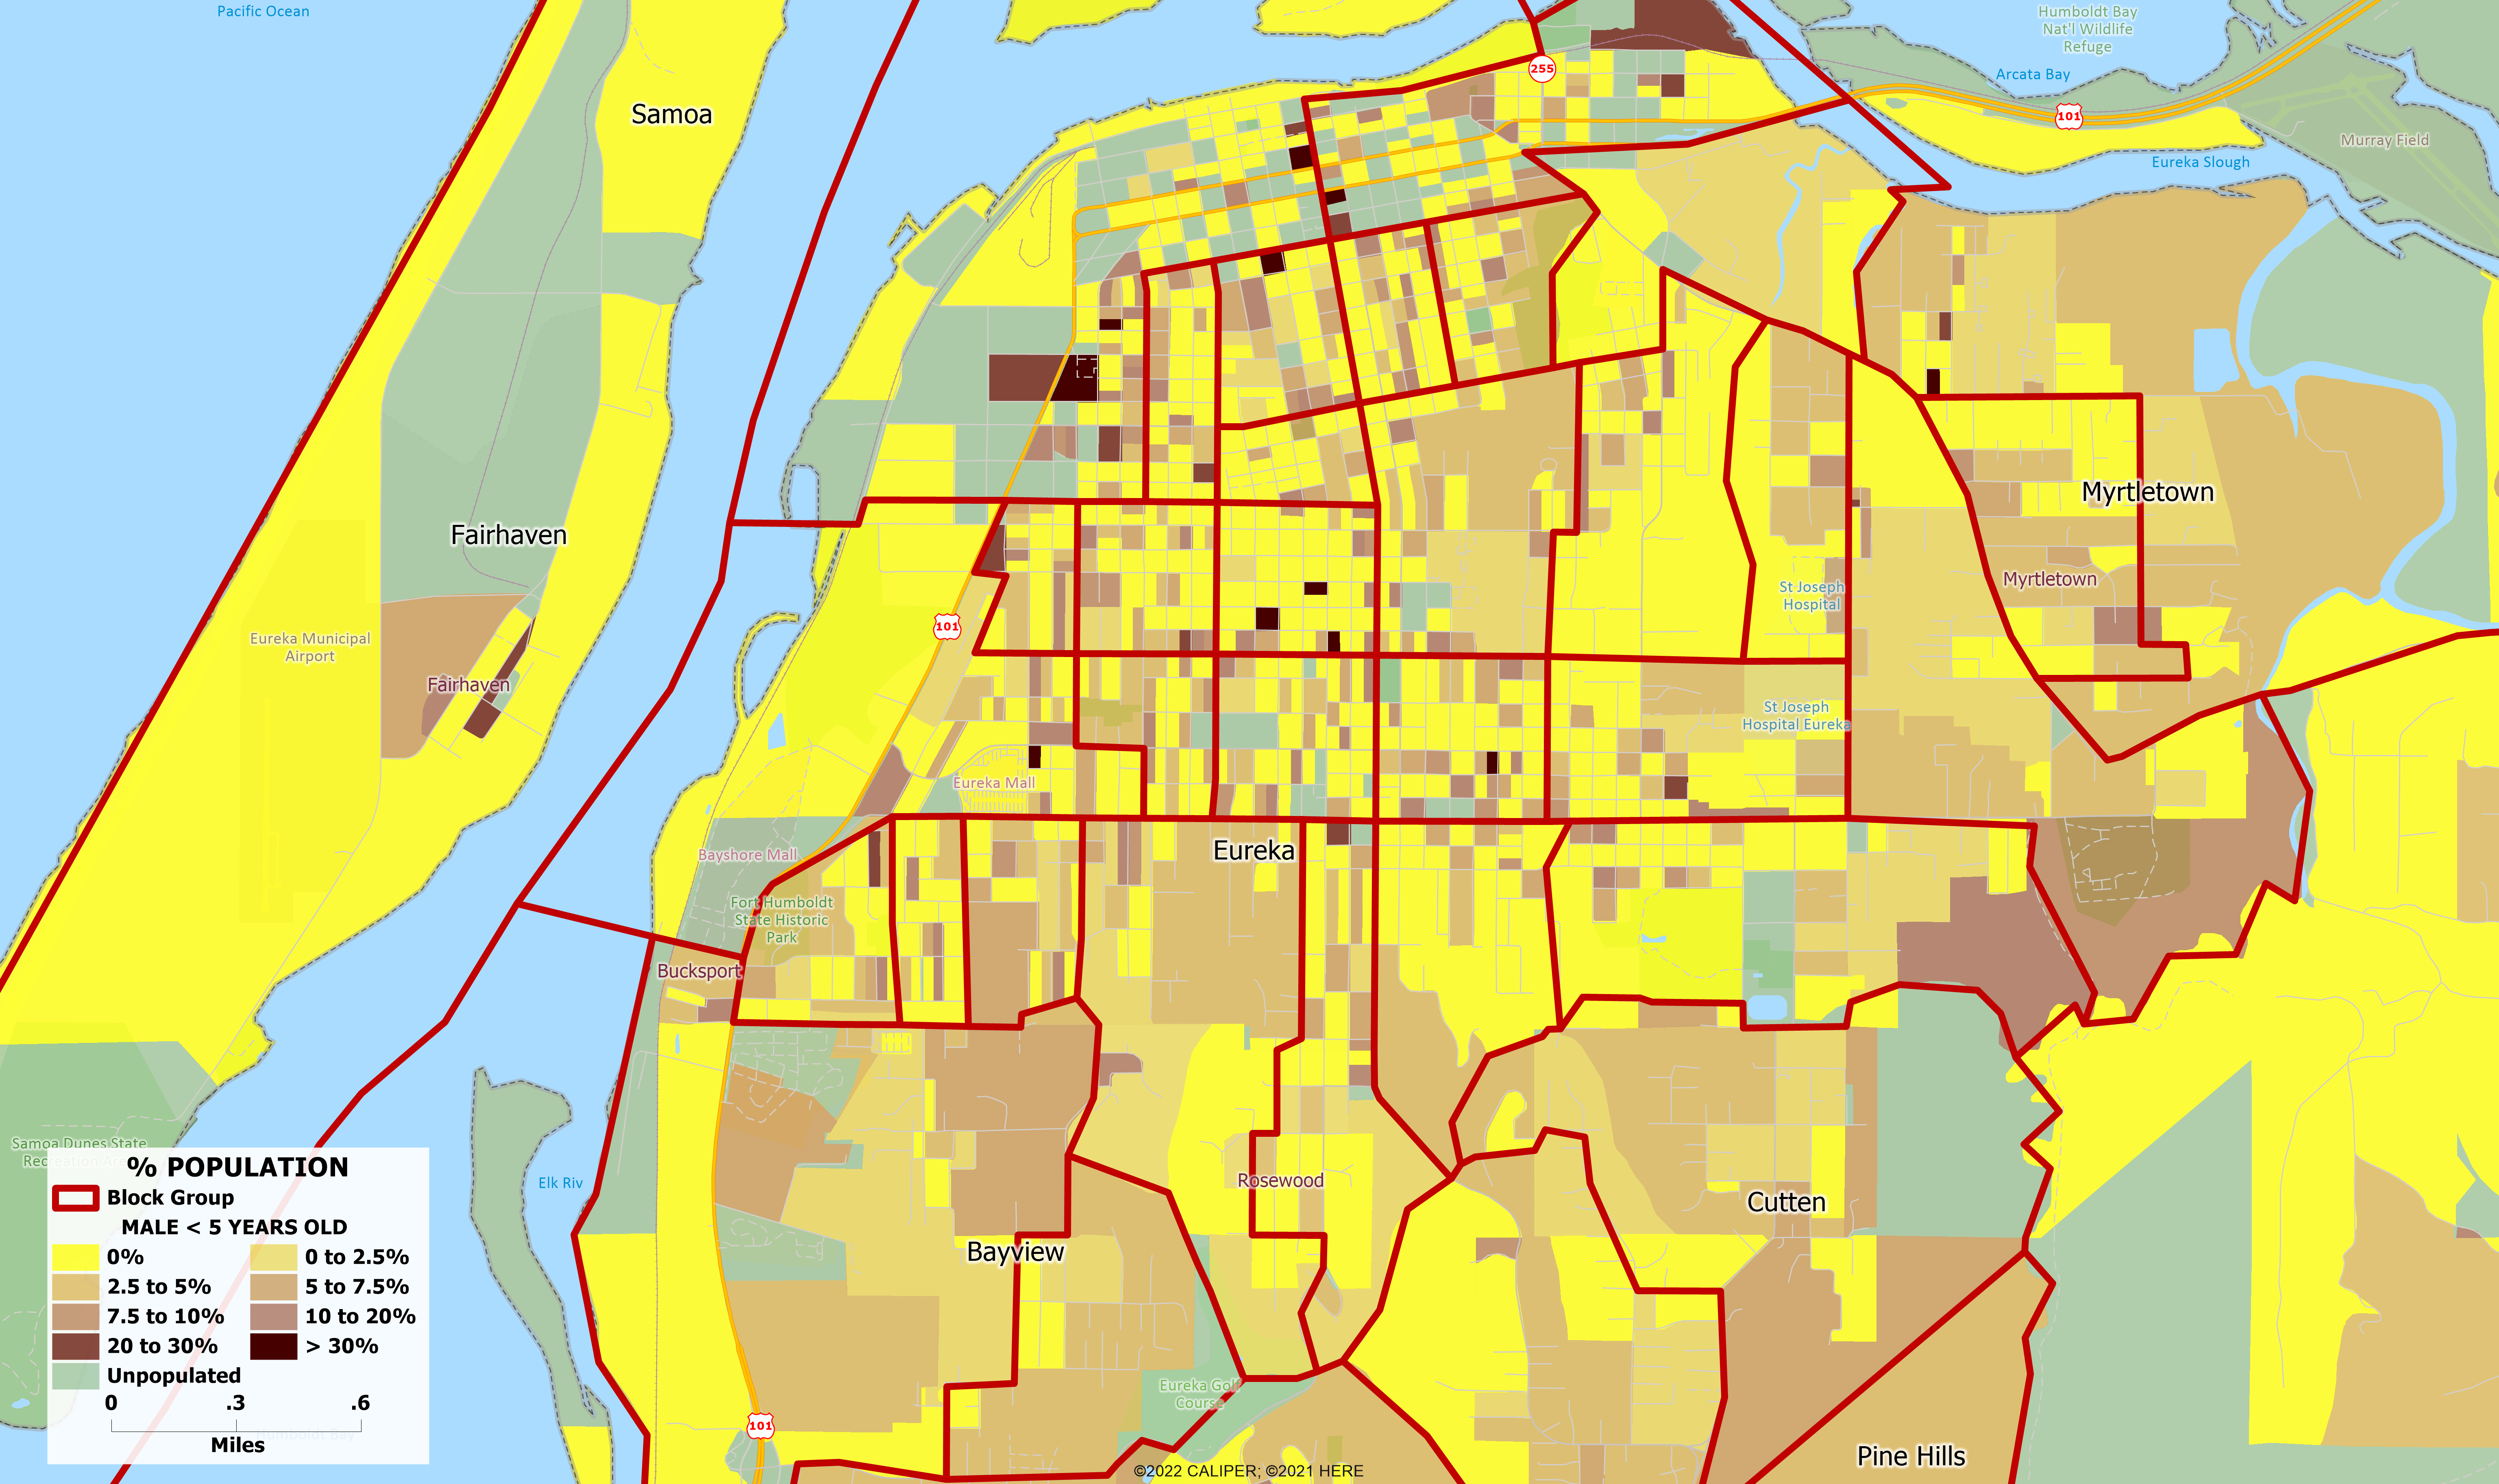
As an example, we mapped the population age <5 for both males and females for Eureka, California. Nationally, just under 6% of the total population is in this age group, and there is no reason to expect that these maps would be different, even at the block level. However, this is not the case. The data is nowhere near what the national average would suggest, with some concentrated areas appearing as though more than fifty percent of the population is under the age of five. In addition, these blocks are often found next to areas that don’t appear to have any people under the age of five at all. Clearly, the DA procedures have left the data in a state which should not be used ‘out of the box’ as the foundation of any serious effort in demographic models. As much as we would like to say otherwise, examples like this can be found for any variable at the block level anywhere in the country.
A serious analysis and remediation of the data is a major effort which cannot be completed in a matter of a few weeks, and any vendor claiming to have integrated the data into their models after a mere six weeks should be avoided at all costs.
Choosing a demographics provider is somewhat like a jockey choosing a racehorse from a stable of thoroughbreds. If you know the track is safe, sure, take the horse that will come out of the gate first. But if the track is a minefield, you likely want to choose the careful horse that doesn’t charge blindly through the field. To simply play the marketing gimmick of being first out the gate is at best a fool’s game that should not be played by any serious and trusted creator of small area demographics.