
In a classic good news/bad news scenario, the recently released Social Security and Medicare trustees report says that the funds won’t be going broke quite as quickly as feared. The bad news, of course, is that a deferral of the inevitable by a year or two doesn’t really matter much. Social Security will no longer be fully funded through employer contributions by 2035, and Medicare won’t be able to fully fund inpatient hospital care by 2028.
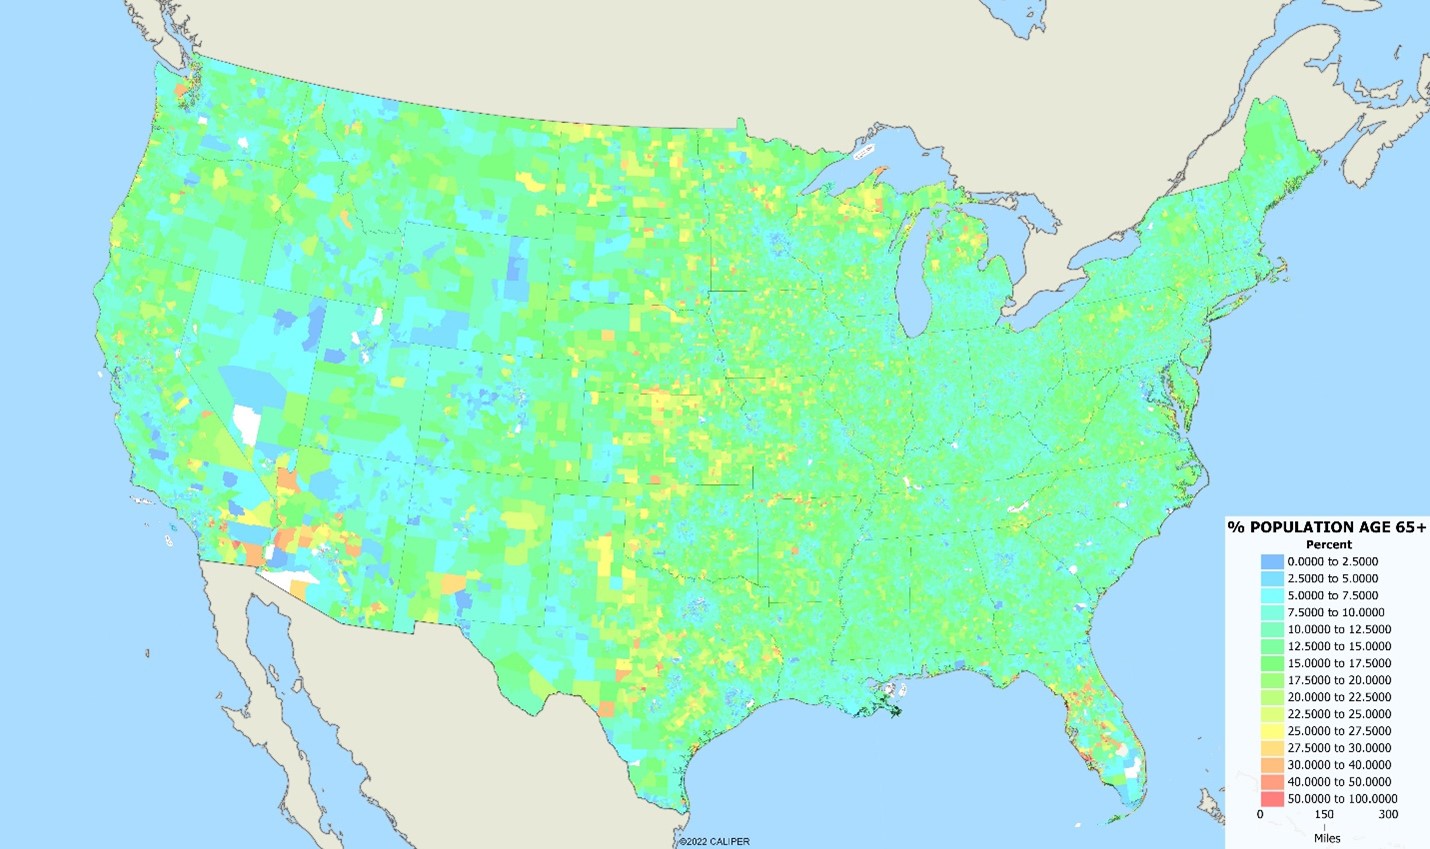
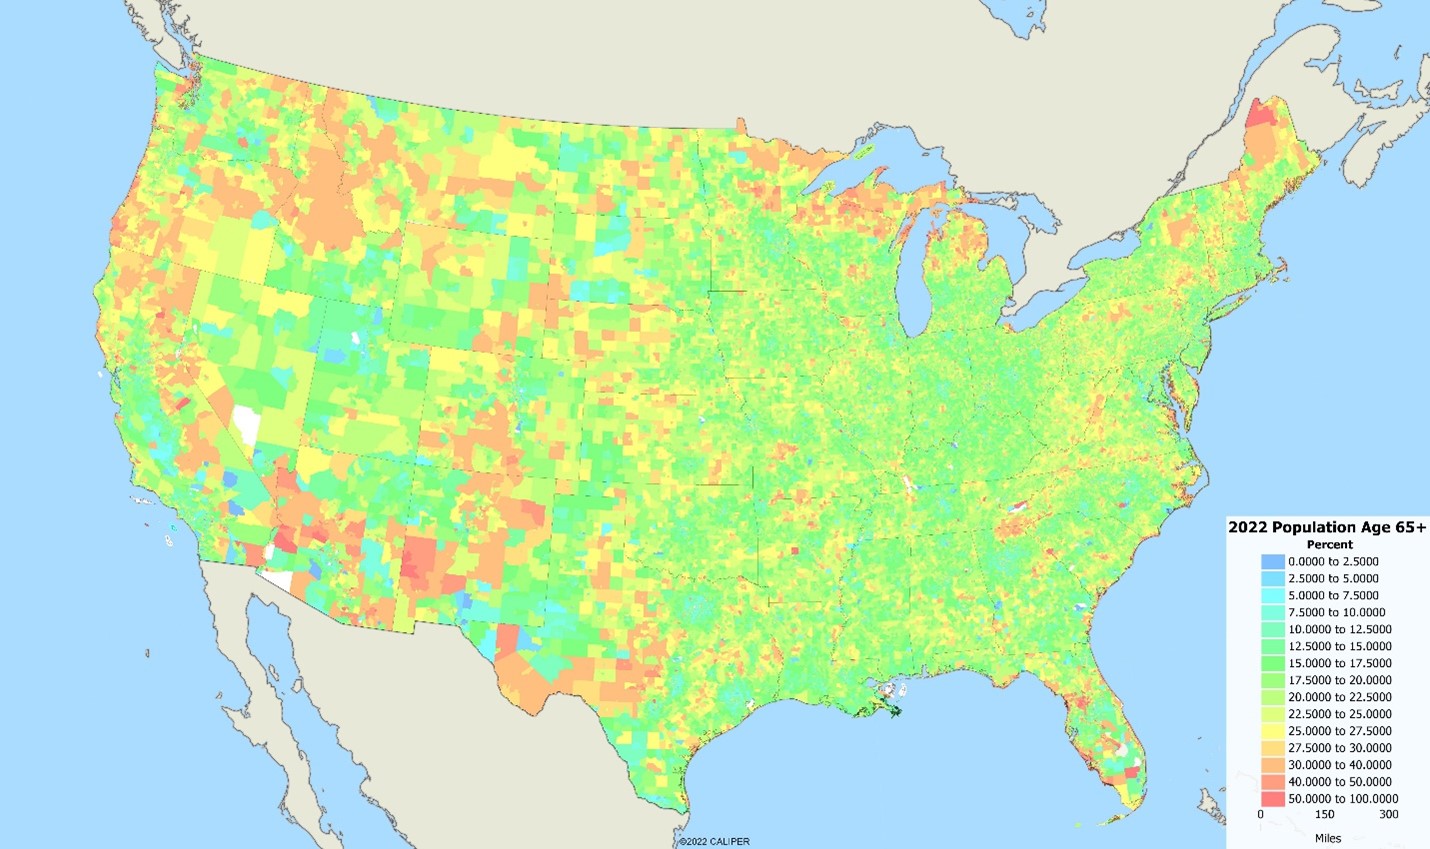
The ageing of the population has long been a favorite demographic story, and while everybody generally knows what is going on, we thought we would revisit the issue. In 1990, Florida had about 18% of its population over 65 years of age – and the only state with more than 1 in 6 people of retirement age. Currently, 14 states have a higher percentage of elderly residents than Florida had just 30 years ago, and only 7 states now have fewer than 1 elderly resident for every six people.
The maps of block group change are instructive – the first for 1990 and the second for 2022 –
Demographers have traditionally used a measure called the “Dependency Ratio”, which compares the population of children and retirees to the population of labor force age. However, with the percentage of the labor force age population increasingly classified as ‘not in the labor force’, we decided to map the ratio of employed workers to the total population. The map below of the northeastern part of the country is generalized by using 3-mile radius areas around each block group:
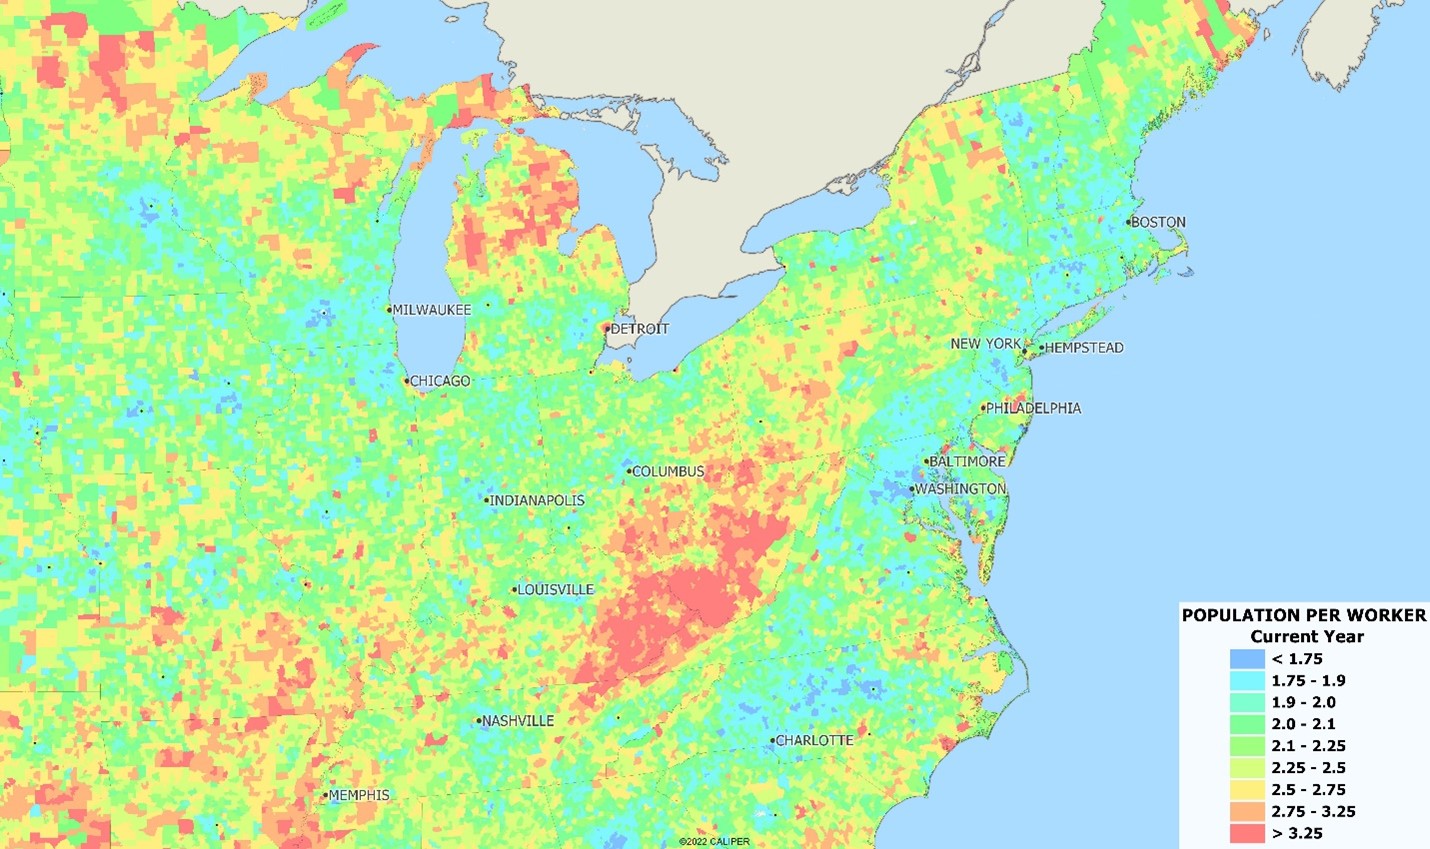
In the largely rural areas of Appalachia and northern Michigan, Wisconsin, and Minnesota, less than one in three people are employed – and contributing to Social Security and Medicare. The urban patterns are interesting as well – economically depressed portions of most major cities have insufficient workers to support adequately support the population.
We can’t help but ask the question – when these funds are no longer self-supporting, where will the money come from? Means testing is certainly on the table, and you can expect to see benefits capped or deductibles increased over time. The political effects of touching the ‘third rail’ of politics are soon going to be felt by the congress that has to implement changes to these programs just to keep them afloat.
Our crystal ball being cloudy when politics meets economics, we can say only one thing – what can’t be paid, won’t be paid.

Recent Comments