The Census Bureau began the task of building a digital map base for the United States several decades ago with the development of the DIME (Dual Independent Map Encoding) files in the 1970’s. By the release of the 1990 Census, the TIGER (Topologically Integrated Geographic Encoding and Referencing) system had become a fully national system at the block level.
The initial development of TIGER was done on a county-by-county level, usually by contractors who were issued a set of guidelines for the delineation of census blocks. The results were a massive leap forward for the geospatial community, but did suffer from a number of problems including:
- Sliver polygons and gaps at county boundaries
- Inconsistent application of the block delineation guidelines, especially related to the handling of private roads (for example, within the property of a shopping center or a gated community)
- Inconsistent delineation of water blocks. In some counties, tiny ponds were digitized as separate blocks which in other counties were ignored.
During the last decade, the Census Bureau expended a considerable effort in correcting these deficiencies, and the result is a much cleaner set of census blocks. Most users, who work at the block group level, will notice that there are over 20,000 additional block groups in the new 2020 TIGER files.
At the block level, substantial change has occurred that actually reduced the total number of blocks by several million. While adding blocks in growth areas, the main benefit of the change is the reduction of the number of unpopulated blocks that were created to stitch together the county level files (sliver polygons) and to make the application of the guidelines more consistent.
The map below shows the reduction in the number of census blocks in an area along the Texas-Oklahoma boundary. The yellow circled areas show where truly nonsensical blocks were removed, shown over a Google satellite image.
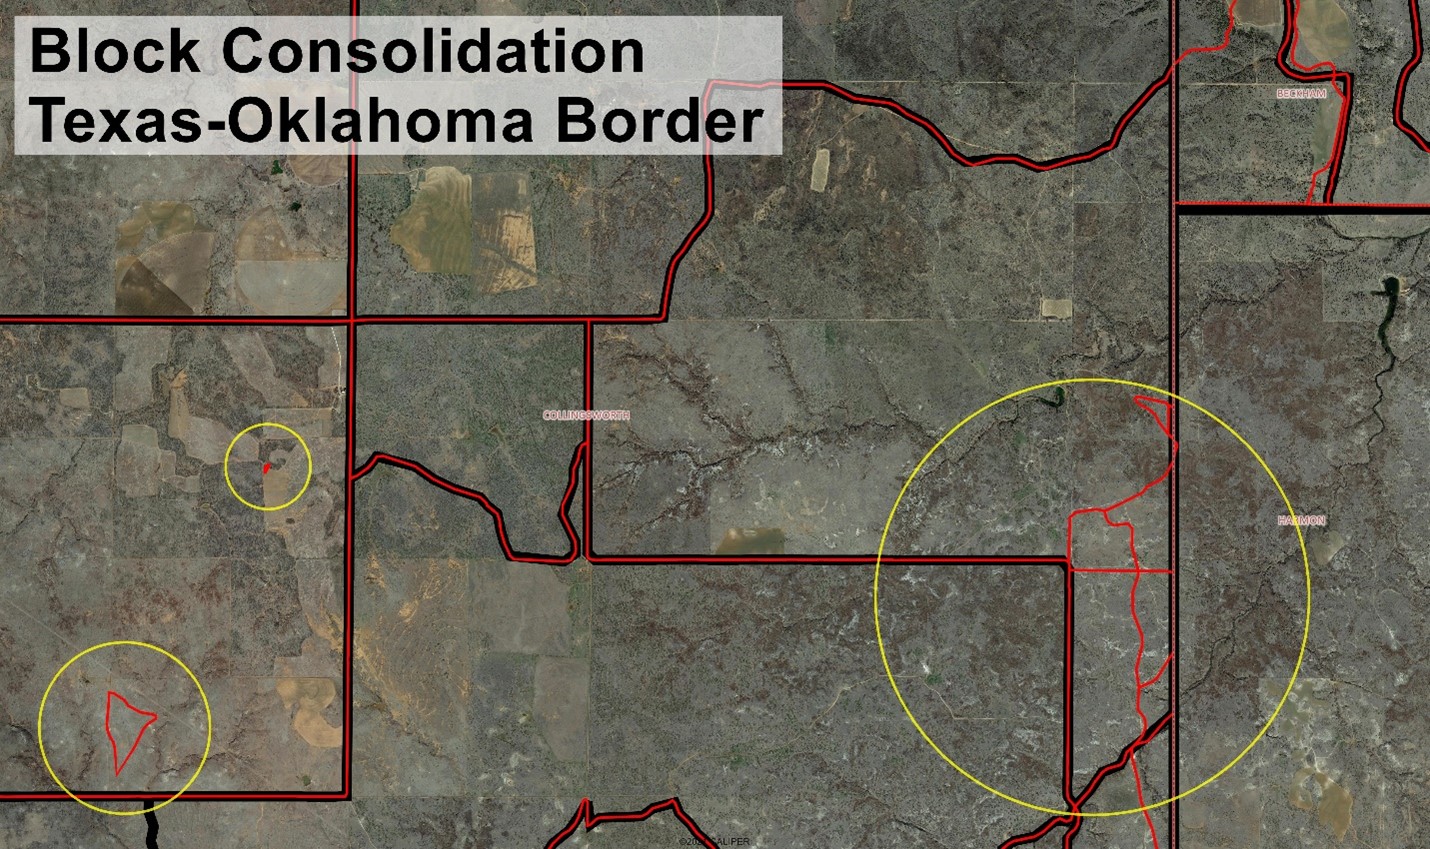
These consolidations are the primary reason why the block count has decreased between the 2010 and 2020 censuses. They do not represent any loss of information, as the vast majority of these blocks were unpopulated.
In growth areas, the 2010 block groups were often split, and the block count dramatically increased. The example below, from Fort Bend, TX, shows the block group and block boundaries for 2010 and 2020 respectively. The 2020 block group boundaries on the first map are shown in green in an area which had 3 block groups in 2010 and now has 5 covering the same geographic area. The block count increased in most parts of the map because of new development, but actually decreased in the northeastern most block group.


Our overall assessment of the 2020 block and block group geography levels is that it is a vast improvement over the previous generations, largely because of the consolidation of blocks in rural areas, the removal of many tiny water blocks, and the elimination of most of the sliver/gap polygons along county and state lines.