In his inaugural state of the union address in early 1964, President Johnson declared war against poverty by implementing a wide range of federal programs aimed at improving the living conditions for residents of low-income neighborhoods, improving access to job opportunities, introducing Medicare, and providing income support through the food stamp program.
By the standards set by the Census Bureau, 11.4% of the population in 2020 lived in poverty, compared to around 15% in the early 1960’s. Poverty thresholds are defined by a combination of household size and age, but quite surprisingly, are applied nationwide so that the income threshold for a family of four in rural Maine is the same as a similar family living in San Francisco – despite radical differences in the cost of living.
But what is poverty? The dictionary definition is somewhat obtuse – “the state of one who lacks a usual or socially acceptable amount of money or material possessions”. It is by its nature a relative term – we all know poverty when we see it, but defining it?
The percentage of the population defined as living in poverty has declined somewhat over the past few decades, from somewhere in the vicinity of 15% in the early 1960’s to 11.4% in 2020. The current threshold for poverty is $13,790 for a single person, and $27,741 for a family of four. These are consistent with definitions established decades ago then adjusted for inflation (using the CPI). Contrast this with the U.N. definitions of extreme poverty which were set in 2015 as under $2.00 per day – or around $700 US dollars a year. Poverty, clearly, is a relative concept.
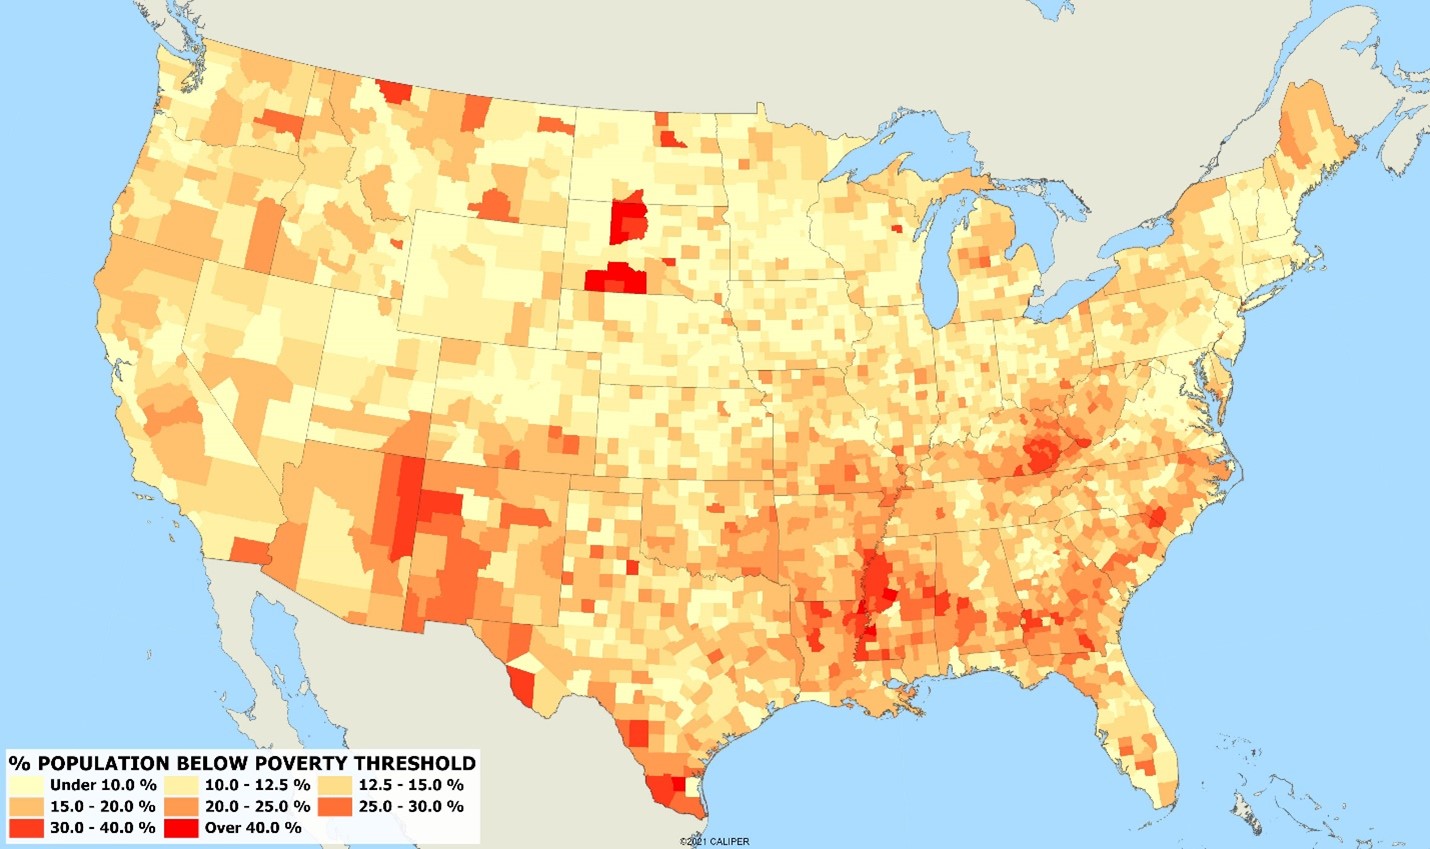
At a county scale, poverty rates are highest in the southeast along the coastal plain from Virginia through Louisiana and north along the Mississippi valley, along the Mexican border, and in the largely native American areas of the west:
If we look at a single metro area, we find that patterns are slightly more complex, but generally as expected. The map below of Cincinnati below shows that poverty rates are highest near the city center and decline out to the suburbs:

Poverty is highly associated with many factors, both in terms of cause and effect. Poverty rates are highest in areas where the percentage of lone parent families is highest, educational attainment lowest, and languages other than English are spoken at home.
Poor areas are often lacking in access to retail and other services, and this is well captured by the retail gap map for grocery stores – and we are especially struck by the stark boundaries between areas of gap and surplus. The map below shows the grocery store retail gap—often called a food desert—in Cincinnati.
