
One of the key problems that analysts face when building multivariate statistical models is multicollinearity in the independent variables. Imagine for a moment that you are trying to predict the demand for books by neighborhood using a simple demographic model. It could be argued that book sales should be higher in high income areas, and higher in areas with greater levels of education. Both are probably true, but the problem is that the two variables are highly related and any regression model which uses both as independent variables will tend to “overfit” the target variable – that is, your model will likely be less effective than expected and its parameters rather unstable.
Demographic Dimensions is a dataset specifically built for modeling applications that removes the problem of multicollinearity from models that rely on the demographic characteristics of geographic areas. The dimensions database consists of twenty-six variables which are the results of a data reduction analysis that used several hundred source demographic variables. Each is statistically uncorrelated with all others and is easily interpreted since each has a national mean of zero and standard deviation of one. The first dimension is “Affluence and Education”, which emerges because income and education are highly related and the most important determinants of a neighborhood’s demographic character.
The dataset is also scale-independent, meaning that differences in the relative size of geographic areas have been removed, leaving only the essential ‘character’ of the neighborhood. Statistical models which attempt to estimate total demand or sales should be formulated as a demand per consuming unit (household, person) model which is then post-multiplied by the number of consuming units.
For those used to the discrete nature of Panorama segments – often used as “dummy” variables in regression equations – the continuous nature of dimensions can greatly improve model performance without abandoning the simplicity of segmentation. Each Panorama segment has been mapped to Dimensions.
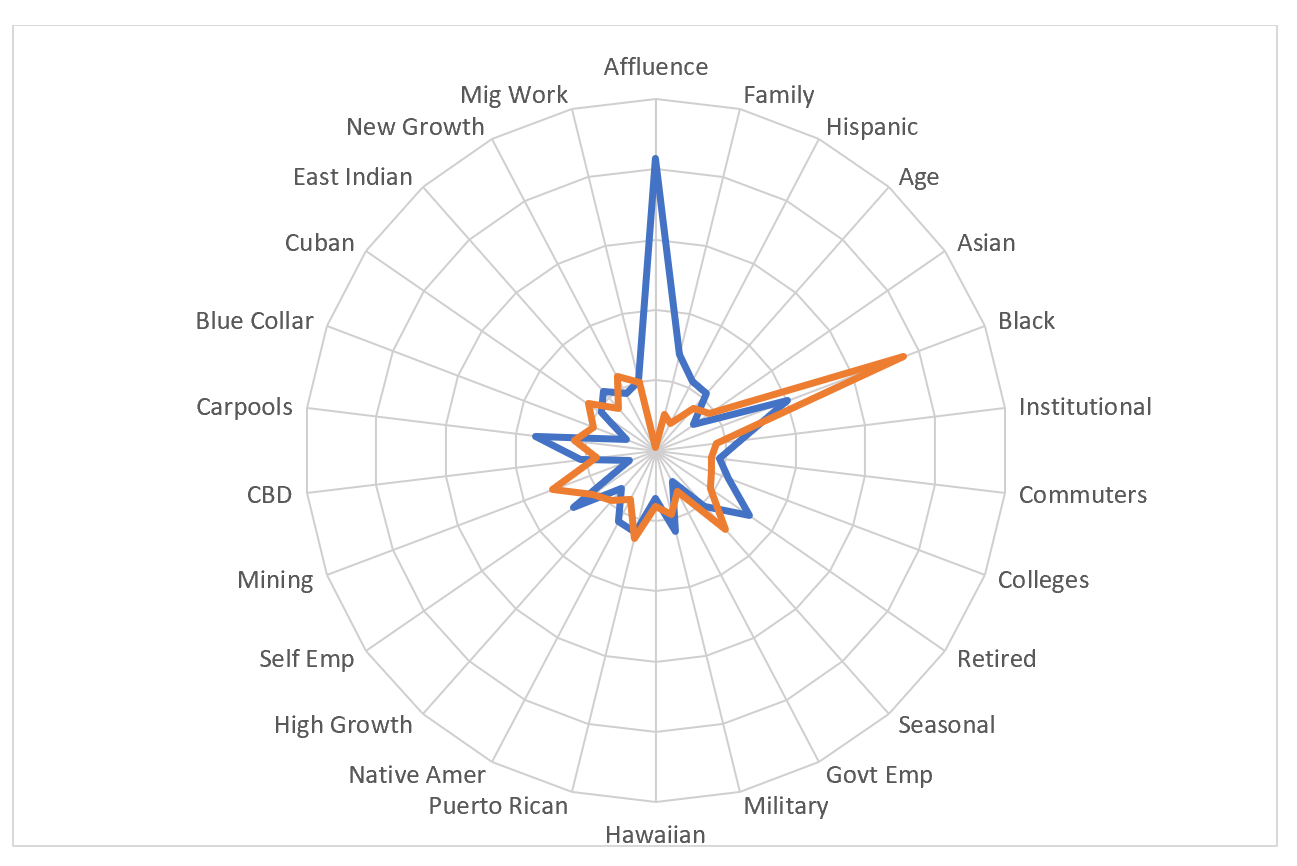
From a graphical perspective, the dimensions can be easily transformed into simple graphics that can help users understand the essential characteristics of an area. The rose chart below shows the dimensions of Panorama segment 01 One Percenters (blue) and 66 Post-Industrial Trauma (orange). It should be noted that the labels are loosely applied, especially for some of the lesser dimensions and are for interpretive convenience only, and that we recommend using the entire set of dimensions rather than one or two.
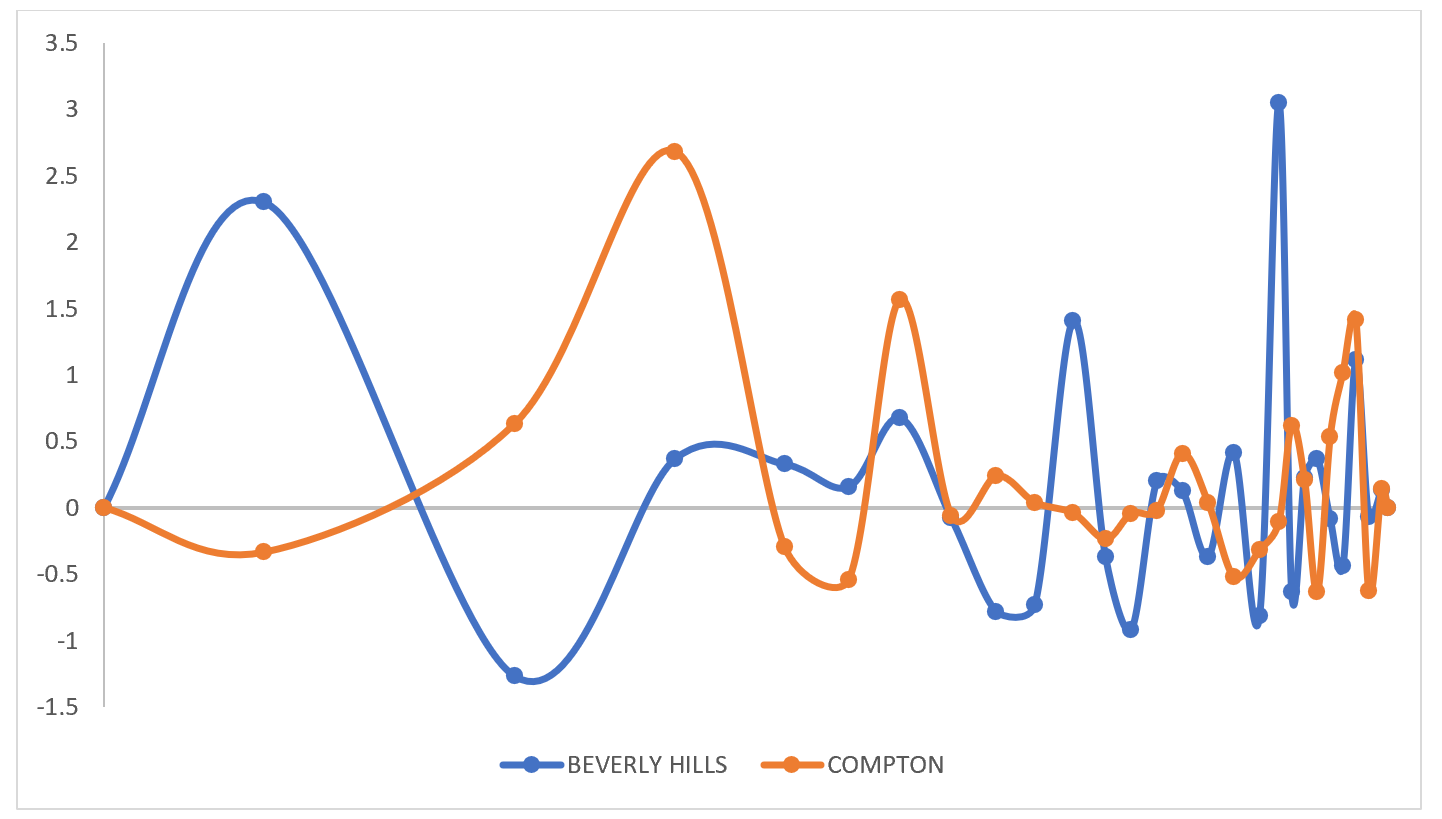
An alternative graphic style for display is what we call the Site Signature graph, which allows the relative importance of each dimension to be represented. Below are shown the signatures for two Los Angeles cities – Beverly Hills and Compton.
More information on the methodology and use of the Dimensions data can be found at https://appliedgeographic.com/demographic-business-dimensions/

This is a very well written article!