
There are lots of small details about where we live that can shape the quality of our daily lives. When we look at those details from a broad geographic lens, those details fade. But when we zoom in, things like proximity to shops and restaurants, environmental concerns and even access to high speed internet can make a big difference in your everyday life. Our reworked Quality of Life dataset brings those differences into focus. With the 2026B release, we moved from five main indexes to seven and from census block groups to census blocks. Here, we take a closer look at the data and modeling behind that rebuild—and what the added detail reveals.
The rebuilt dataset scores approximately 8.1 million census blocks, compared with roughly 239,000 block groups in the previous version. It brings together 158 measures into 40 sub scores, which contribute to seven main indexes: Economic Security, Health and Well Being, Education and Opportunity, Built Environment and Mobility, Safety, Natural Environment, and Social Capital and Civic Life.
The rebuild incorporates 21 new topics and 20 additional national data sources. These additions range from childcare and digital access to traffic safety, transportation noise, civic engagement, and economic mobility. Each sub score draws on several measures, giving users more context for understanding the conditions behind a location’s overall score.
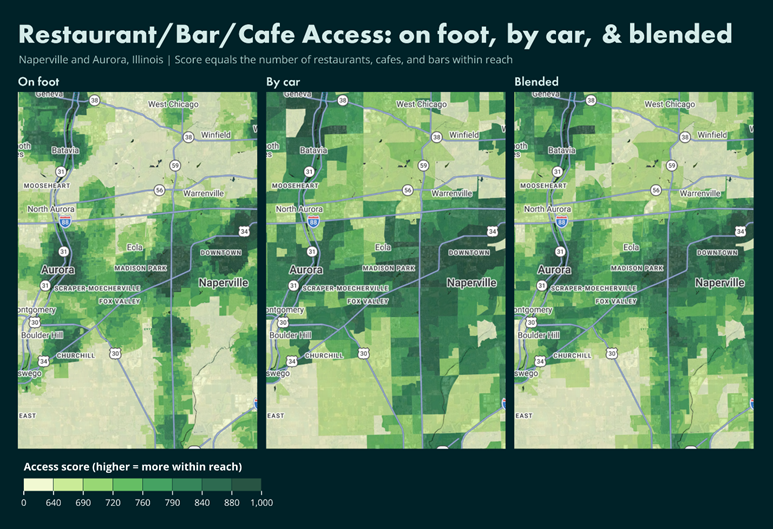
Having a restaurant nearby and being able to reach it easily are different things. A walkable downtown and a suburban neighborhood may both offer convenient dining options, but residents reach those options in different ways. To better reflect those differences, we calculated walking distances and drive times from millions of points across 26 amenity categories. Nearby destinations receive more credit than distant ones, with the influence of distance adjusted by category. Walking and driving access are then blended according to each neighborhood’s walkability.
The maps of Naperville and Aurora, Illinois, show how that changes the picture for restaurants, bars, and cafes. Walking access is more concentrated, while driving puts a broader range of destinations within reach. The blended measure accounts for both, recognizing that convenience does not look the same in every neighborhood.
Transportation noise illustrates the value of finer geography. A block group containing a major highway may include both homes near traffic and residential streets farther away. A single block-group measure can obscure that difference. In the Denver comparison, block-level data reveals the transportation corridors more clearly and identifies many residential blocks with no area at or above the mapped 55 dBA threshold. This measure considers the share of each block exposed to transportation noise from roads, aircraft, and rail.
Digital access offers another example. The map of Lochbuie and north Brighton, Colorado, shows how the fastest advertised home download speed can change from block to block. The rebuilt dataset uses FCC broadband availability, excluding satellite, and considers both the top advertised speed and the number of high-speed providers. These are practical details for households relying on internet service for work, school, and everyday tasks.
Fastest advertised home download speeds available on each block around Lochbuie and north Brighton. Availability measures service offered, rather than actual household connection speeds.
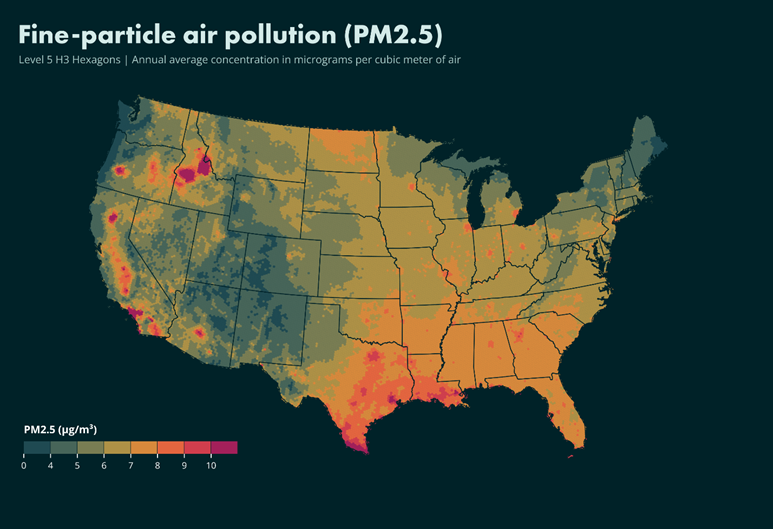
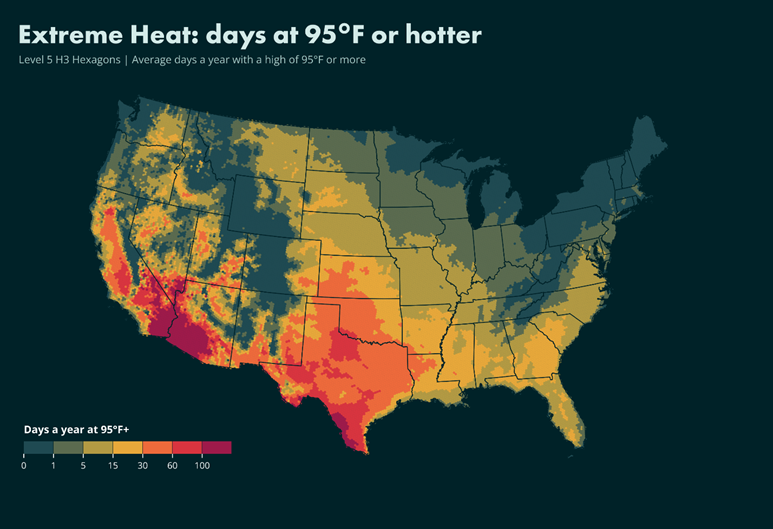
The rebuild also draws on our expanded Environmental database. Climate measures now account for extreme heat and summer humidity alongside cold, cloud cover, rain, and snow. Air quality incorporates wildfire smoke and industrial air toxics alongside six standard pollutants, while hazard measures cover ten natural hazards.
The national maps show two different dimensions of environmental conditions: annual average fine-particle air pollution, or PM2.5, and the average number of days reaching 95°F or higher. Shown here in H3 Level 5 hexagons, these maps provide a national perspective on measures contributing to the more detailed local analysis.
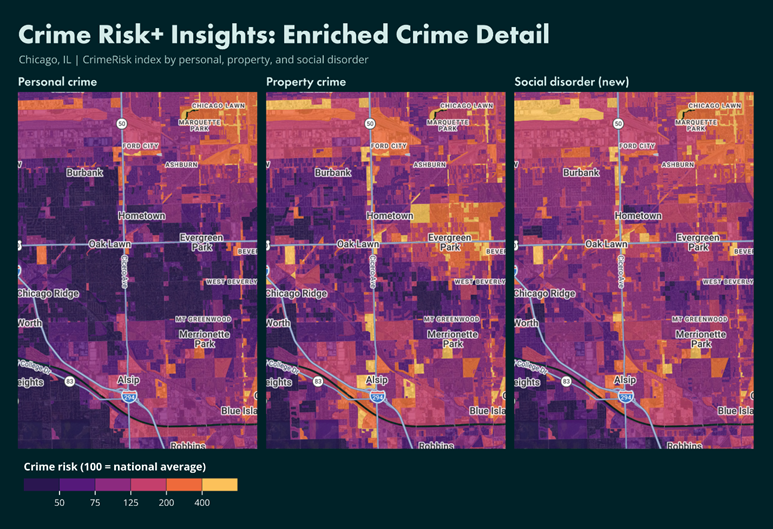
Crime risk has also gained detail. Powered by CrimeRisk Insights+, the rebuilt dataset includes social disorder alongside personal and property crime at the block level. The Chicago-area maps show how those patterns differ across the same neighborhoods, adding context that a single crime measure would miss. Safety also considers traffic fatalities, climate, air quality, and hazard exposure.
For a residential developer, an economic development team, or a community planner, the value lies in understanding the conditions behind the score. Where are services within reach? How much do environmental conditions vary locally? Which strengths and challenges sit alongside one another? The rebuilt Quality of Life dataset provides more ways to investigate those questions, combining broader coverage of everyday life with the geographic detail needed to see differences within a community.