
Environmental conditions help shape how people experience a place, from the noise along a major highway to the sunshine a community receives throughout the year. With the upcoming 2026B release, AGS is expanding our Environmental database with additional measures of environmental quality, natural hazards, land cover, and climate. The additions provide more details for comparing locations and understanding the conditions surrounding homes, businesses, and potential development sites. The following maps offer a look at several of the new measures.
Transportation noise follows a distinct pattern across metropolitan Atlanta. Major roads form a network of elevated noise exposure, while Hartsfield-Jackson Atlanta International Airport stands out as a concentrated source. Smaller airports and railroads also contribute to the pattern.
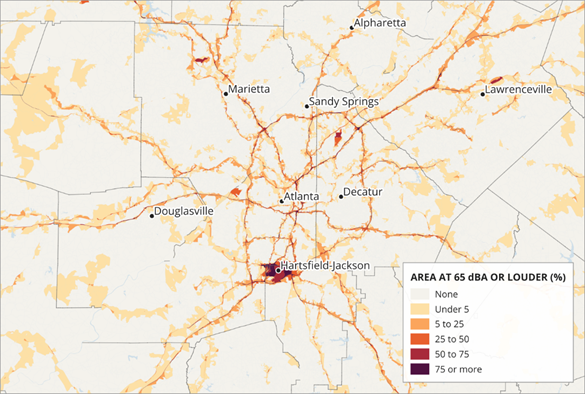
The map shows the percentage of each area’s land exposed to transportation noise at 65 dBA or louder. This distinction matters: the shading represents how much of an area meets that threshold, rather than its average noise level. The expanded database includes mean transportation noise, exposure at additional thresholds, and separate measures for road, aviation, and rail noise, providing several ways to examine the local sound environment.
The expanded database includes annual average concentrations of fine particulate matter, or PM2.5. The California map below shows 2024 levels, measured in micrograms per cubic meter, with elevated concentrations across the Los Angeles–Riverside area and parts of the Central Valley.
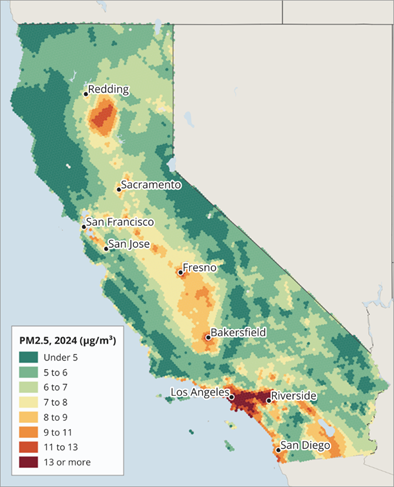
The Northern California hotspot reflects the influence of wildfire smoke during 2024. It is a useful example of how environmental conditions can vary within a state and how fires can contribute to the air quality patterns captured in an annual measure. The release also adds smoke-day measures at different smoke densities and a wildfire smoke index, alongside additional air quality variables.
Flood mapping is valuable for comparing locations, but gaps in source coverage can make a national analysis difficult. We combine FEMA flood maps and model the gaps to provide national coverage in its Flood Hazard Index.
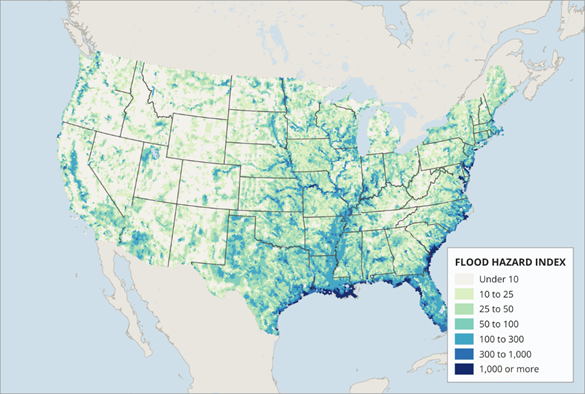
The map shows broad concentrations of a higher hazard along the Gulf and Atlantic coasts, as well as patterns following major river systems inland. Bringing mapped and modeled areas together allows users to examine flood hazards across markets within a single database. Additional flood variables include a future flood hazard index, the share of an area assessed, and the shares within the 1% and 0.2% annual-chance flood zones.
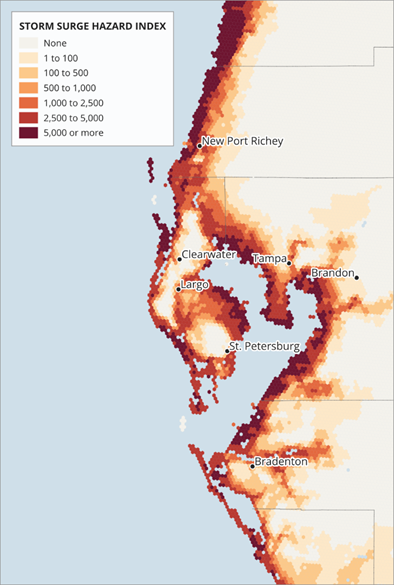
The map of Tampa Bay illustrates how storm surge hazard varies around a coastal region. Higher index values trace much of the Gulf shoreline and extend around the shores of Tampa Bay, with substantial differences over relatively short distances.
The pattern shows why proximity to the open coast alone does not fully describe a location’s exposure. Bayfront areas also stand out, adding useful context when comparing coastal communities and sites. The Storm Surge Hazard Index joins other natural hazard additions, including measures of sea level rise, landslide susceptibility, and wildfire burn probability.
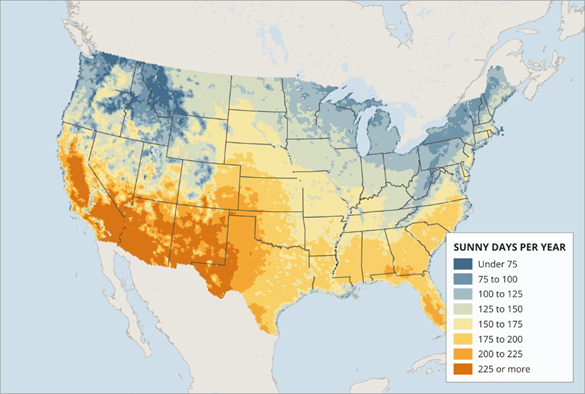
The sunny days map shows a familiar national pattern, with more sunny days across the Southwest and fewer across much of the Pacific Northwest and Great Lakes region. The database includes both annual and monthly sunny-day measures, allowing users to examine seasonal differences as well as annual totals.
These additions sit alongside expanded cloud cover, precipitation, temperature, and wind measures. New variables also describe extreme heat and cold, warm nights, freeze dates, and the length of the frost-free season.
Together with additions covering nighttime light, radon, toxic releases, tree canopy, and other land cover characteristics, the 2026B release broadens the environmental context available for location analysis. Users can combine these measures with AGS demographic and market data to build a more complete picture of the places they study.