We have focused on the disclosure avoidance techniques used by the United States for the 2020 census a great deal over the past few years. Given our expansion a few years ago into Canada and our coming expansion into Mexico, it is useful to compare the disclosure avoidance methods used by their respective census agencies.
If you missed last week’s article on the practical meaning of privacy, it is worth a read for background and context and can be found here.
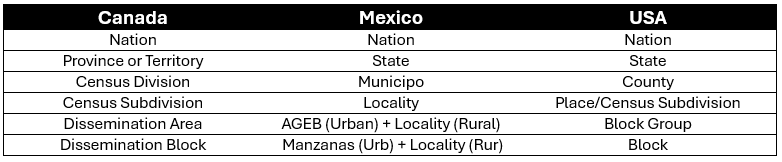
In each case, data is tabulated and released for several levels of geographic hierarchy, usually nested but not necessarily covering the entire territory (e.g. metropolitan areas). The main hierarchical geographies of each country are listed below – with certain adjustments we have made for Mexico:
Canada: Random Rounding
For decades, Statistics Canada has used a simple random rounding technique for small area data. Exact statistics are released only for large geographic areas (provinces, metropolitan areas, large census divisions). For all other smaller geographic areas, all statistics are evenly divisible by 5. Legitimate zeroes remain zero, but all other values are rounded. The rounding is not completely random – a value of 9 has a higher probability of being rounded to 10 than to 5.
If we had a table of age groups by sex, each cell is randomly rounded independently. This is generally considered to be a good strategy for protecting privacy, but it does have some effects which users should understand:
- There is no guarantee that the values of any table (such as population by age) will match the total
- There is no guarantee that the values of any variable, summed to its ‘parent’ geography (e.g. all dissemination areas in a census subdivision) will equal the published value at the parent level
- For small geographic areas, tables can be ‘lumpy’, especially for multidimensional tables.
Mexico: Suppression
The Mexican census agency uses suppression rather than distortion. For any particular geographic area, values under a certain threshold (usually 5) are simply not published. All other values are presented without modification.
In general, national and state level statistics are presented without any suppression. For more detailed areas, suppression is dependent upon the size of the area. For complex tables (e.g. age by sex), many of the cells of the table will be missing for smaller population areas. However, because the control totals for higher order geographies are likely fully known, estimation techniques can be used to fill in some values precisely and others using maximum likelihood methods. The estimation of missing cells proceeds from the largest scale (national) to the smallest scale (block group).
The effects on data users are complex:
- The smaller the population of an area, the higher the proportion of its detailed elements is estimated rather than exact.
- Tables can be forced to sum to their respective totals which constrains error to the parent geography level.
- The distribution of size of geographic units is critical and affects rural areas much more heavily than urban areas.
United States: Geographic Dispersion
Until the 2020 census, we would have characterized the US method as one of ‘Household Swapping’, whereby households have relatively similar characteristics (size, age of persons, etc.) between nearby units.
The 2020 census used a complex set of techniques which avoid rounding or suppression. One of the key points is that each attribute (e.g. population or females age 45-49) are treated individually. Entities are moved to nearby spatial units to concentrate them to the point where private information would not be disclosed. In general, tables will sum to their expected totals, but that total may in and of itself be modified. The results at the block level are extremely ‘lumpy’ and result in major statistical anomalies that include occupied dwellings with no people, people with no occupied dwellings, and blocks with children but no adults.
The distortions are substantial, and the results show sharp divisions between adjacent areas where no such divisions really exist. Further, the integrity of tabular data is severely compromised, and the raw data is not usable for many purposes for individual small areas.