With Helene still visible in the rear-view mirror and communities from Florida to Virginia still without power, water and connectivity, this week’s Milton delivered more misery and damage to the southeast. Two in the space of a couple of weeks must be unprecedented, right?
Many claim that we are getting more hurricanes, and these are more intense, because of climate change. Does the data back that claim up?
In most areas of the world, we have meteorological records dating back no more than about one to two hundred years. Only in recent decades have there been enough weather stations around the globe to even begin to analyze global patterns, so most of what we know historically is anecdotal or by unprovable inference. Historically, we do know that there have been massive climactic shifts from super warm and dinosaur infested, to somewhat chilly and ice covered, and back to warm (albeit without the dinosaurs), all without the aid of humans. Climate change? Absolutely. Humans able to change the direction of the natural cyclical changes? The data might not show that.
That said, we looked at the National Oceanic and Atmospheric Administration (NOAA) website for some charts and patterns, and we highly advise people to take a look at the fine work done by these scientists by heading here: https://www.nhc.noaa.gov/climo/.
Are Hurricanes becoming more frequent?
Here is a chart showing the number of storms recorded by year since 1860:
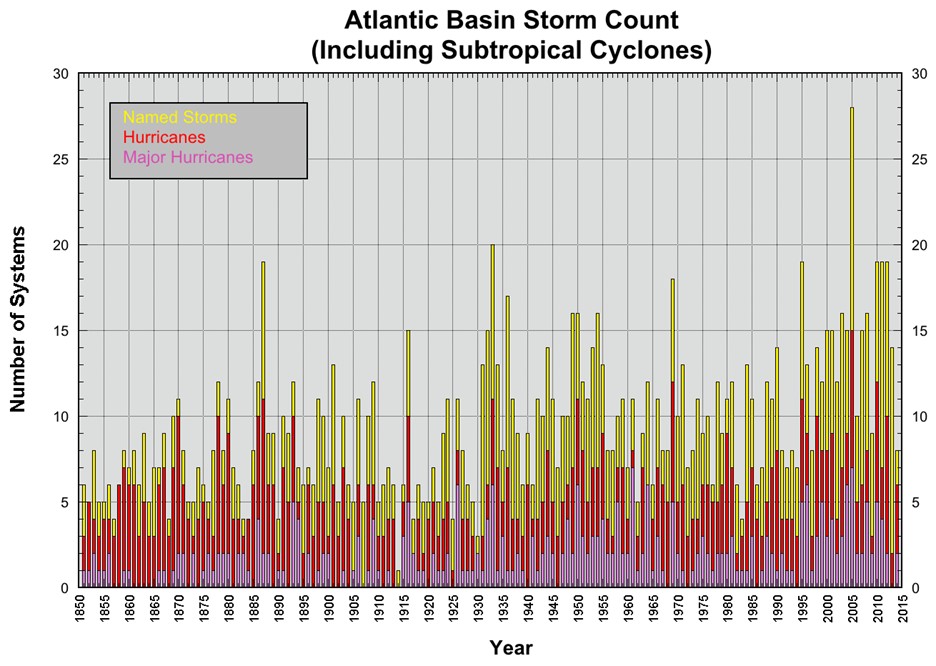
Note first that the data for the first few decades is most certainly missing a lot of storms which simply died out before making landfall along coastlines which were largely unpopulated between the major ports.
About every 40 years, there is a peak of activity. The last 20 years does seem to be worse than the previous decades, but the real change in the chart appears around the turn of the 20th century, which we suspect is when measurement began in earnest because the question was posed: “can we predict hurricanes and by doing so warn the people?”
Are They Becoming More Severe?
Yes, the damage from hurricanes has increased over the last few decades. Most numbers tossed about are in current dollars, meaning that any comparison of even Katrina to this year’s storms is deliberately misleading. These must be expressed in constant dollars if there is to be any credence afforded to them. But more significantly, the coastal population of the United States has increased dramatically over the last few decades in the most vulnerable areas in the Gulf of Mexico and the South Atlantic coast. We see this as somewhat akin to the discussions we hear in the west about damage from wildfires – after all, if a tree falls in the forest and nobody is there, does it make a sound? A storm that makes landfall along an unpopulated coastline does little monetary damage.
By decade, the worst to date was the 1950’s, when ten major hurricanes made landfall (https://www.nhc.noaa.gov/pastdec.shtml). The first half of this decade already had five such major storms but given the variability (between 4 and 10 per decade), no reasonable statistician would conclude that the dynamics of such storms had changed in the last few years. Indeed, we think it foolhardy to even suggest that a changed pattern may be developing based on just a couple of years given the length of geologic history on the planet. It does make good fodder for the 24/7 news crowd though.
If I was to tell you that I had been studying the NYSE for the last 10 minutes, would you bet the farm on my stock picking forecasts that were based on the last three seconds of data?
But One After Another?
The map below shows the average period between major hurricane strikes at various places along the eastern coastlines –
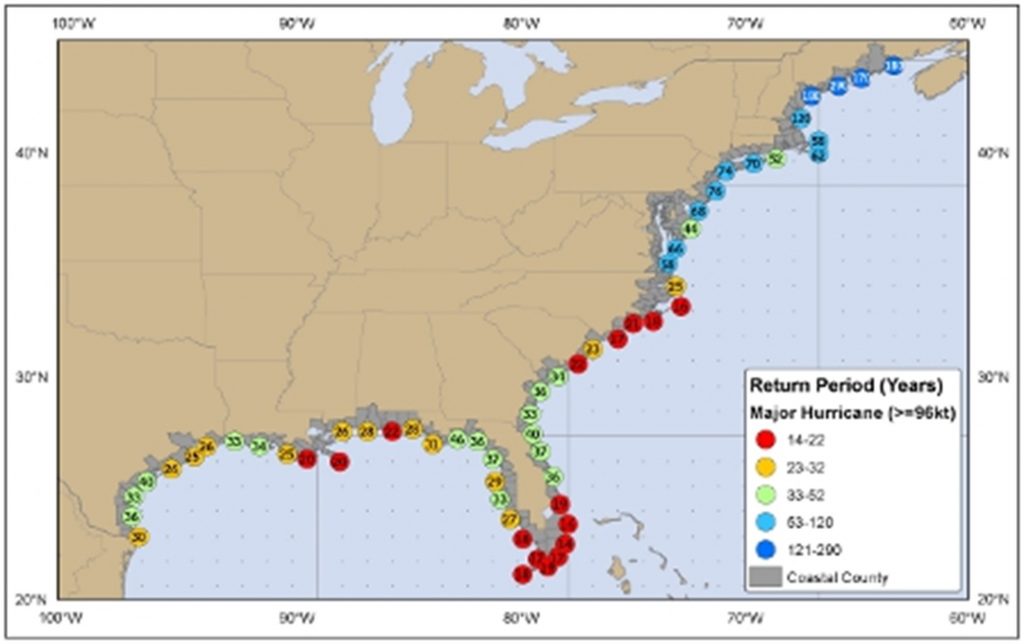
In the original maps, the period between hurricane strikes is shown on the map – and ranges from a high of Miami (every 14 years) to central Maine (290 years). The peak locations are south Florida, the Gulf of Mexico between Houston and Mobile, and the North Carolina coast. But if we look at the major storms which have made landfall over the past few decades, we can find several examples of two storms making landfall within fifty or so miles of each other in the same season:
- Connie and Ione (1955), Cape Hatteras area
- Cindy and Gracie (1959), South Carolina
- Erin and Opal (1995), Mobile-Biloxi
- Jeanne and Frances (2004), central Atlantic coast of Florida
- Rita and Wilma (2005), South Florida
- Delta and Laura (2020), Mobile-Biloxi
Remember the picture of 100 people in a stadium, and you were asked ‘how many pairs of people share the same birthday’? The odds of finding 2 pairs of people sharing a birthday are shockingly high. We suspect the same with hurricanes.
Any Good News?
First, the season is well past its peak —
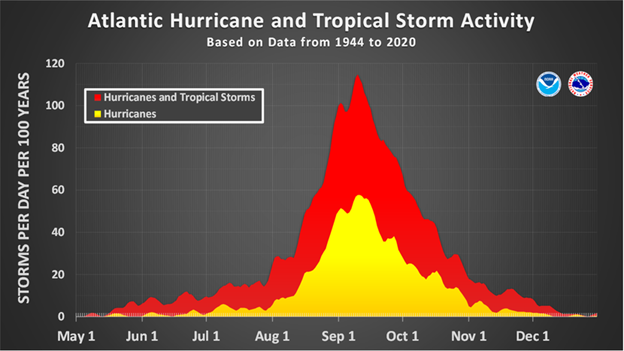
While we aren’t quite out of the woods yet, the decline in storm formation in October is steep, and we are closing in on the mid-point of the month.
Second, about one in every 6 years on average are hurricane free in the United States, and we are about due for one of those (the last was in 2015).