
For 28 years, AGS has been helping users understand the geography of crime. Throughout that time, we have continually refined our CrimeRisk models, incorporating additional source data and improving our methods to better reflect the places where crime occurs. Our new CrimeRisk Insights+ add-on builds on that experience with expanded crime categories, detailed larceny measures, and time-of-day and day-of-week differentiation. With data developed natively at the census block level, these enhancements offer a closer look at patterns that broader geographies—and broader crime categories—can obscure.
In Madison, Wisconsin, the new Social Disorder Index illustrates why spatial detail matters. The map displays block-level estimates with block group boundaries for context, revealing substantial variation within those larger areas. Higher modeled risk is concentrated around university areas, particularly the University of Wisconsin–Madison, although other pockets stand out elsewhere in the city. Assigning one value to an entire block group would smooth over these differences. Block groups are not homogeneous, and a campus, commercial corridor, and nearby residential neighborhood can have very different risk profiles despite sharing the same boundary.
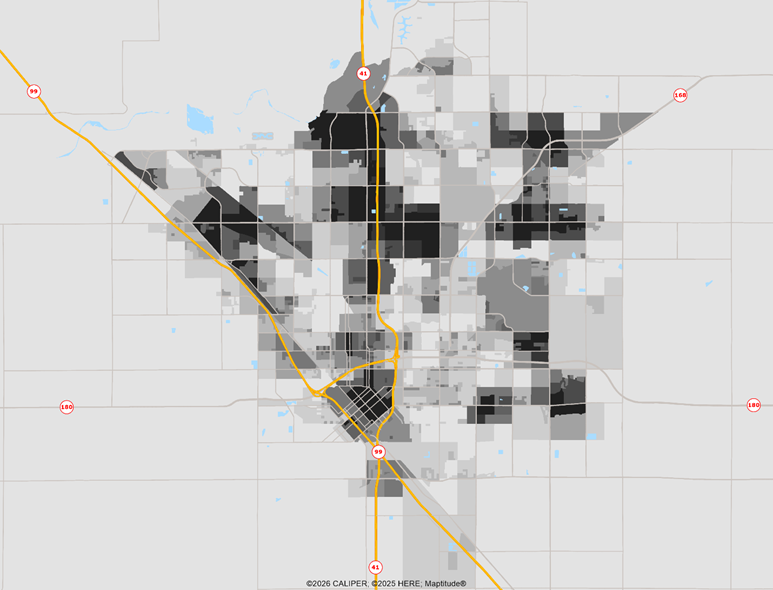
Fresno, California, provides an equally useful example through the new shoplifting variable. The darker blocks indicate higher modeled shoplifting risk, with concentrations in areas heavily occupied by retail. Stores are where shoplifting happens—hardly a shocking revelation! But identifying those concentrations separately from other forms of larceny makes the data more useful. A retailer evaluating a potential location needs to understand the specific exposure relevant to its business, rather than relying exclusively on a property crime index that combines several different offenses. Native block-level detail helps distinguish retail concentrations from surrounding areas.
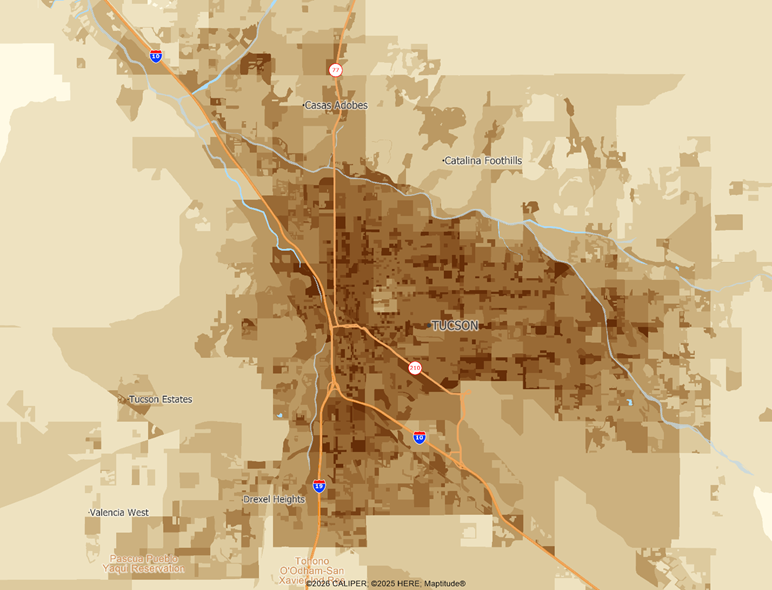
The Tucson vandalism map shows another pattern that can disappear when data is summarized too broadly. Higher modeled risk follows identifiable street corridors and clusters of blocks, with differences visible across relatively short distances. An overall city or ZIP code score would miss much of this local variation. For property owners, site selection professionals, and businesses evaluating potential locations, understanding where vandalism risk concentrates can provide more relevant context for maintenance, security, and operating decisions.
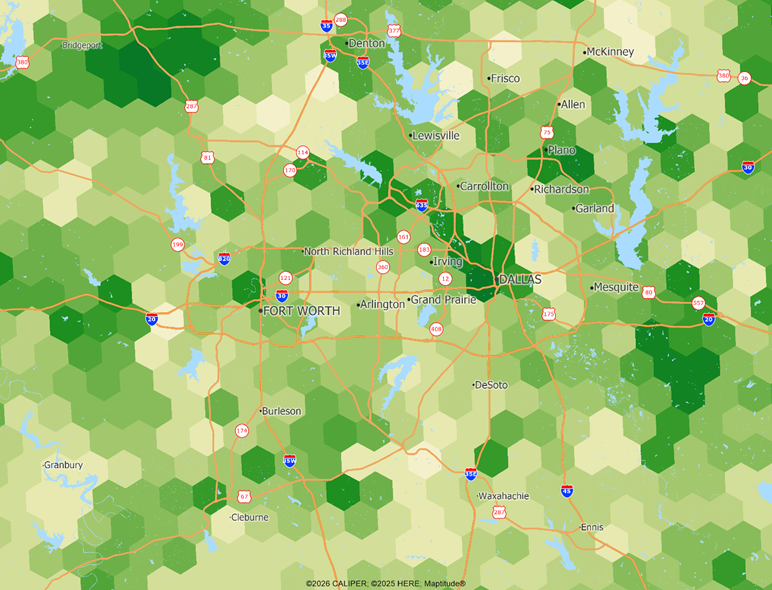
Looking across time adds another dimension. The Dallas–Fort Worth map compares burglary indexes from 2017 to 2026 using level 6 hexagons, with darker areas showing relatively higher burglary and lighter areas relatively lower burglary in the comparison. Several developing suburban areas stand out, while many older, established areas show relative improvement. As development adds homes, businesses, and activity, the geography of crime can shift alongside it. These are changes in relative index values, however; a lighter area does not necessarily mean fewer burglaries in absolute terms. The comparison highlights how the regional distribution of risk evolves
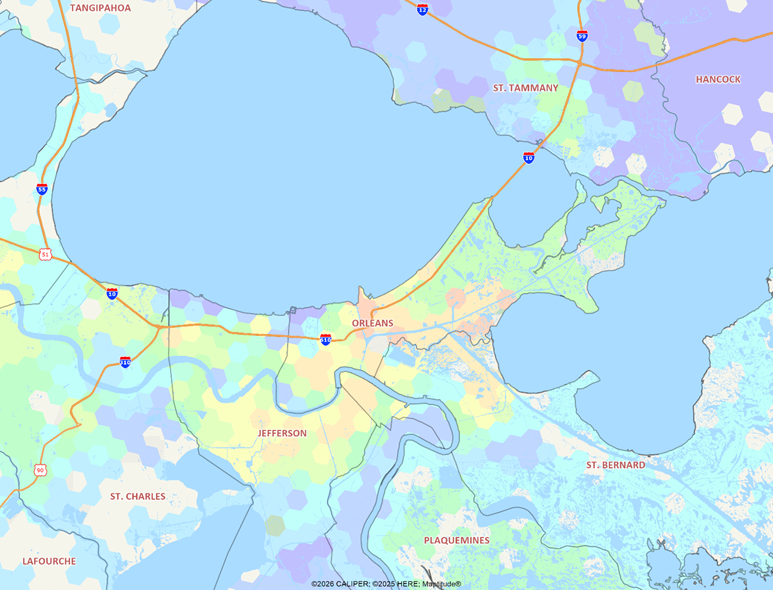
Weapons violations introduce an additional layer of interpretation. Around New Orleans, the level 7 hexagon map reveals localized differences, with blue indicating lower modeled risk, red higher risk, and yellow intermediate values. The pattern varies across the metropolitan area and surrounding parishes. This category also raises questions that extend beyond local land use: what constitutes a weapons violation, how incidents are recorded, and how laws are enforced can affect the patterns reflected in the underlying data.
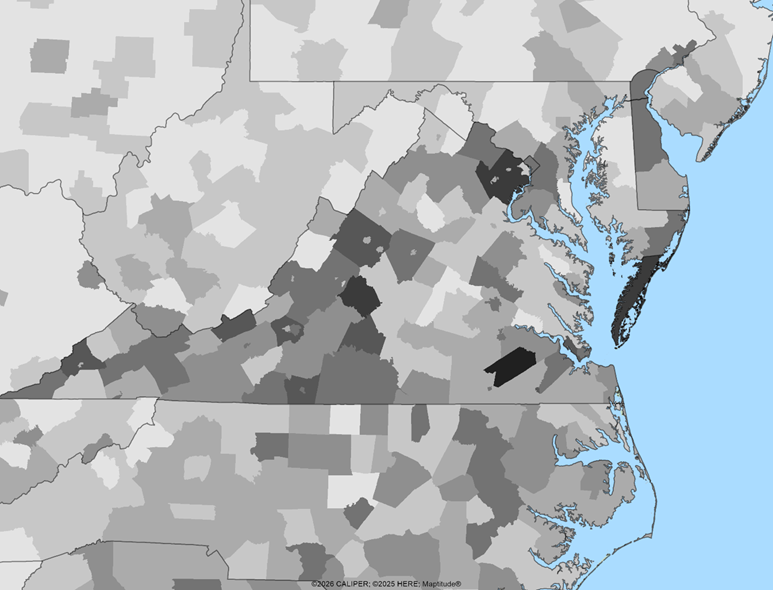
The county-level weapons map offers a broader view of that issue. Virginia stands apart from several neighboring states, while Delaware also displays a distinct pattern. These contrasts may reflect differences in laws, enforcement priorities, and reporting practices, alongside differences in underlying activity. The map alone cannot establish which factors drive the variation, but it demonstrates why weapons violations deserve their own analysis. Understanding the category and its context is essential to interpreting the geography.
CrimeRisk Insights+ also differentiates selected summary indexes by weekday daytime, weekday nighttime, weekend daytime, and weekend nighttime. A location’s risk profile on a Tuesday morning may differ considerably from its profile on a Friday night. Together, the expanded categories, native block-level estimates, and timing distinctions give users more ways to ask relevant questions. After 28 years of refinement, we are still finding ways to bring the geography of crime into sharper focus.