
Sneak Peek: Quality of Life
A great job, a short commute, affordable housing, good schools, and a coffee shop around the corner. Add clean air, nearby parks, and a safe neighborhood, and we might have found the perfect place to live. Of course, finding all those things in the same location is easier said than done. As the Rolling Stones said, you can’t always get what you want. Choosing where to live often involves tradeoffs, and understanding those tradeoffs is at the heart of our revamped Quality of Life dataset.
We have extensively redesigned the database, drawing on our experience with the previous version and incorporating additional data to better capture the conditions that shape everyday life. The existing framework combines five main indexes—Economic, Health, Community, Leisure, and Physical Environment—at the block group level. The revamped version expands that structure to seven main indexes and moves all variables to the census block level. That means both a broader view of quality of life and a much more detailed look at how it varies within a community.
The seven indexes are Economic Security, Health and Well Being, Education and Opportunity, Built Environment and Mobility, Safety, Natural Environment, and Social Capital and Civic Life. Together, they contribute to the overall Quality of Life score, while allowing users to examine the individual strengths and challenges behind it. As before, results are provided as either a standard 100-based index or a score ranging from 0 to 1,000.
This is more than a reshuffling of categories. Some components have been combined or dropped, others have been strengthened, and new measures address aspects of daily life that deserve greater attention. Economic Security considers affluence and employment alongside affordability, poverty, wealth, income inequality, and economic mobility. A higher income is certainly helpful, but how far that income goes matters, too.
Health and Well Being brings together longevity, self-reported health, chronic disease burden, and access to healthcare, food, and physical activity infrastructure. Education and Opportunity includes educational attainment, K–12, childcare access, and post-secondary access, with a new Digital Access component. Access to opportunity involves more than having a school nearby; it also includes the infrastructure that helps people learn, work, and participate.
Another new component is Local Self Containment, part of Built Environment and Mobility. It attempts to measure how much daily activity can happen locally without requiring long trips to another town or across the city. Alongside walkability, commute burden, and vehicle access, it helps distinguish between places where every day needs are close at hand and those where nearly every errand requires a drive.
We also improved the underlying data and broadened several measures. Restaurant and Dining Access now includes more casual dining and coffee shop options, reflecting the places people use regularly. Air quality indexes have been completely rebuilt at the block level. Safety encompasses crime risk, traffic safety, climate, air quality, and hazard exposure, while Natural Environment considers green space, natural amenities, natural setting, and population density. Social Capital and Civic Life captures social cohesion, civic engagement, street homelessness, cultural amenities, social infrastructure, dining, and shopping.
The Seattle maps illustrate why the move to census blocks matters. Green indicates more favorable scores, while purple indicates less favorable scores. The Safety and Social Capital maps show different patterns across the same metropolitan area: a location’s strengths in one category do not necessarily carry over to another. Block-level detail helps reveal variation that a broader geography can smooth over, giving users a more useful starting point for neighborhood analysis.
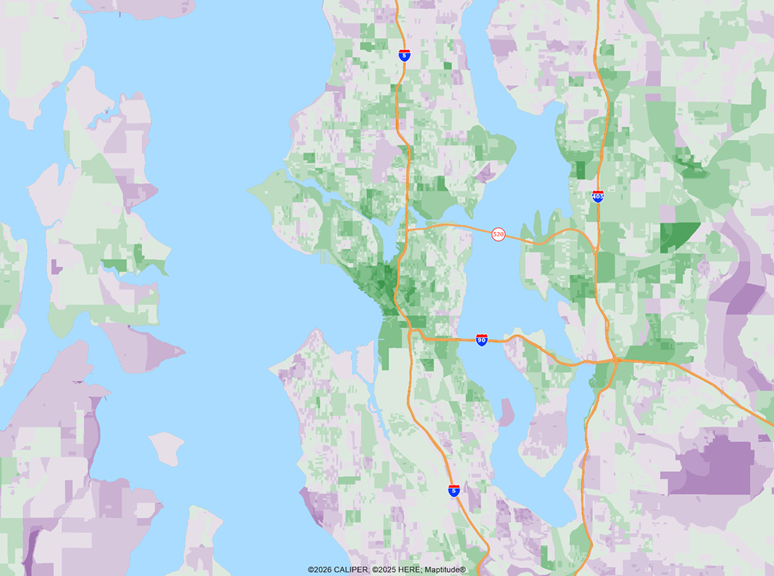
Seattle Environmental
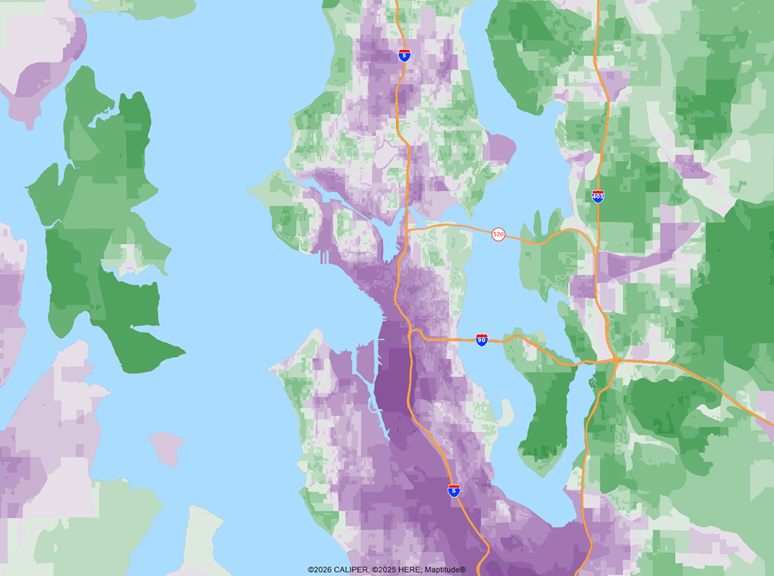
Seattle Safety
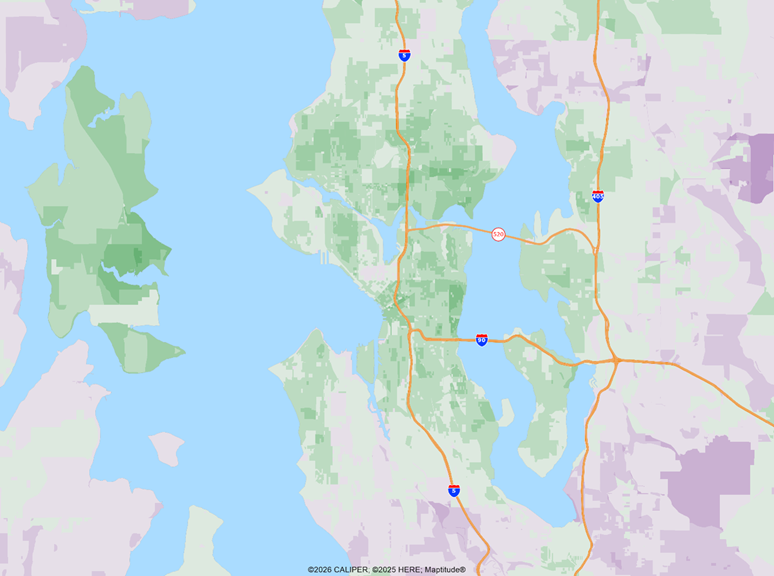
Seattle Social Capital
At the national scale, the level 5 hexagon maps provide a broader perspective. Viewing the individual indexes alongside the overall score helps explain why one summary measure cannot tell the entire story. Strong economic prospects can come with higher costs, more crime, greater air pollution, or fewer natural amenities. Access to open space may come with longer trips to jobs, healthcare, and shopping. These relationships are not universal, but they are precisely the kinds of tradeoffs worth examining.
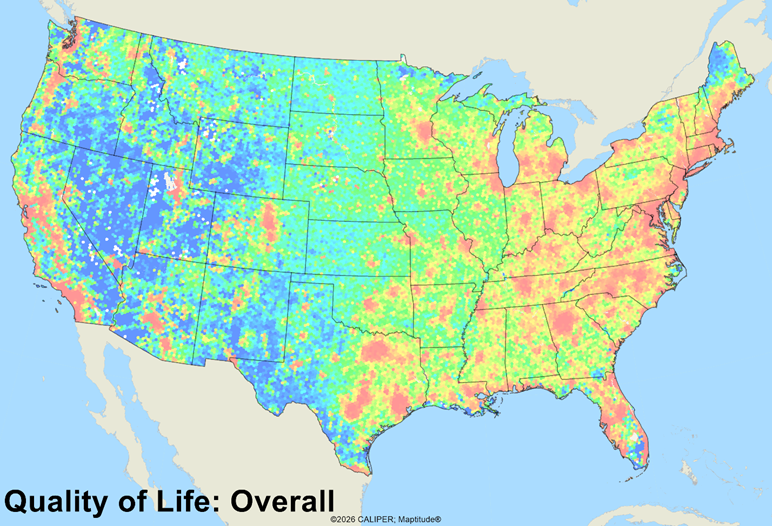
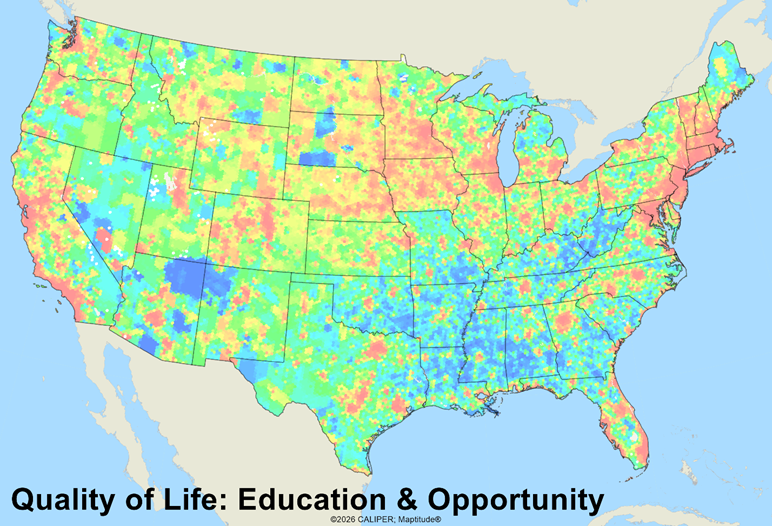
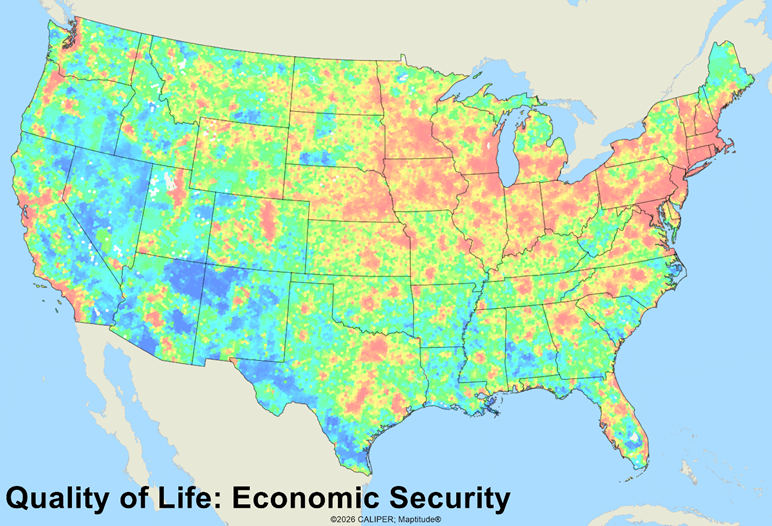
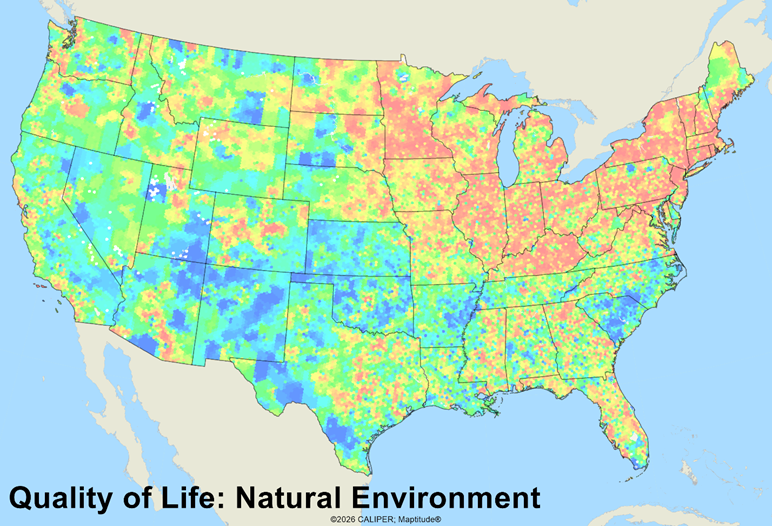
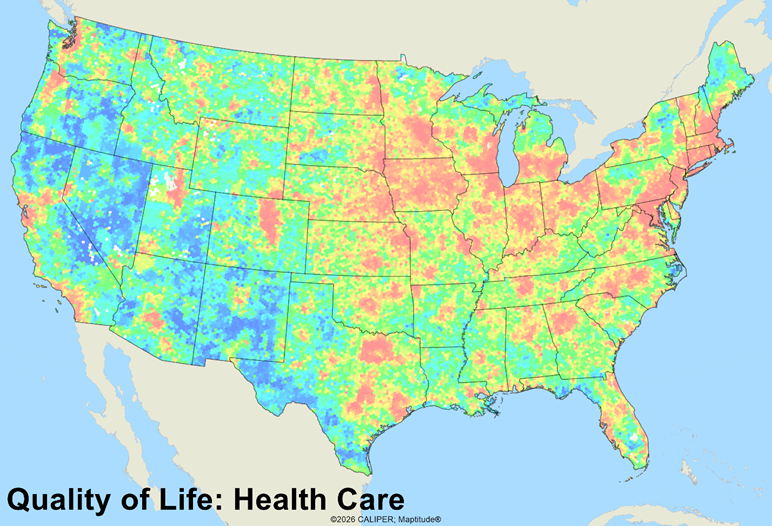
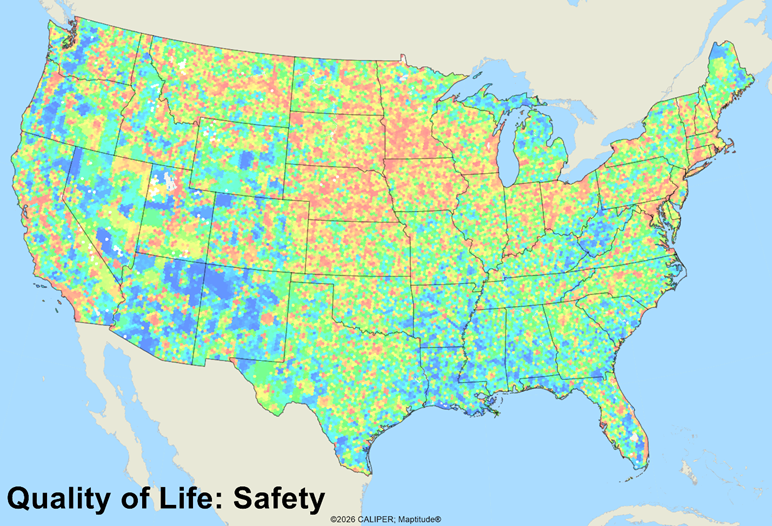
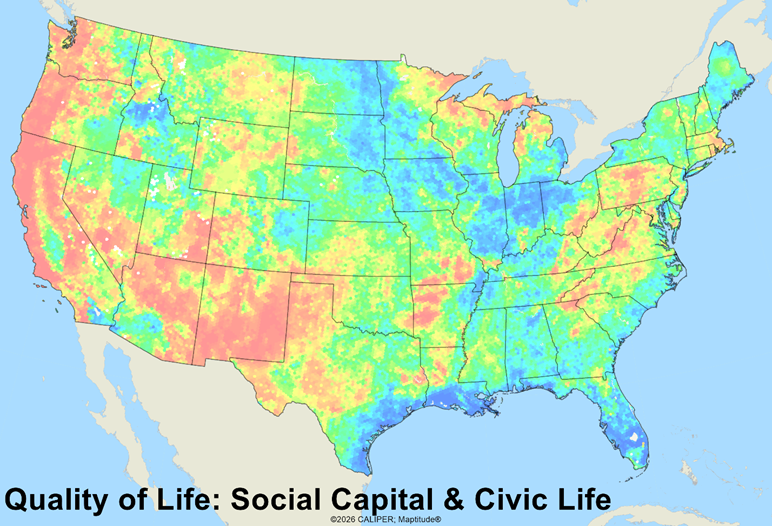
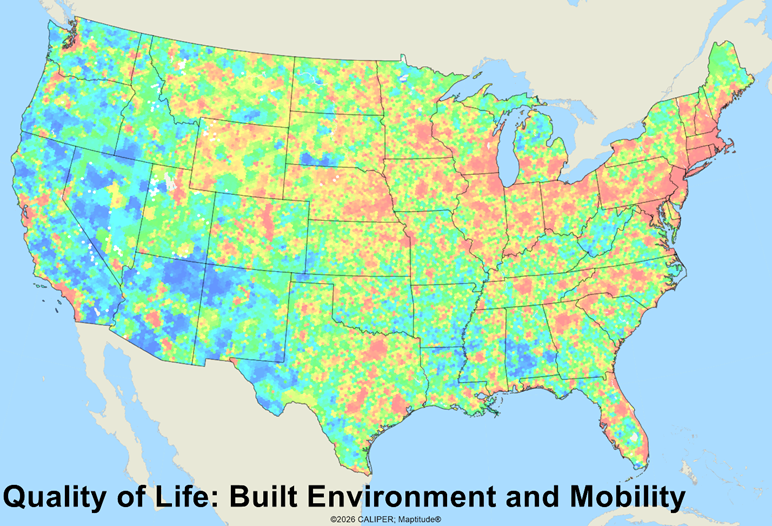
There is also a built-in urban bias in measures centered on access and choice. Rural communities often have fewer services, located farther apart. That does not mean rural life is inherently lower quality; it means that proximity to jobs, healthcare, and shopping is one aspect of quality of life, rather than a complete definition of it.
For site selection, community planning, and market analysis, the revamped dataset offers a clearer way to explore those differences. The overall score provides a starting point. The seven indexes—and the block-level detail behind them—help explain what makes a location work, where it faces challenges, and which tradeoffs matter most.