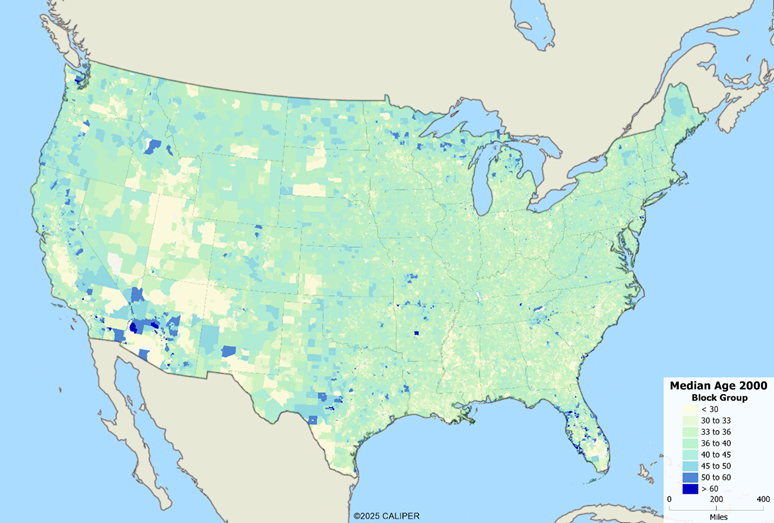
The United States is getting older. In 1980, the national median age was just 29.3 years. Four decades later, that number has climbed to 38.0 — and by 2025 it will reach approximately 38.1, according to our estimates and projections.
This story isn’t unique to the United States. Canada, despite historic immigration levels, sits even higher with a median age of 39.3. Mexico, meanwhile, remains much younger at 27.6, though even in Mexico demographic shifts reflect migration patterns — younger people are leaving many rural northern regions for economic opportunity in the U.S.
What does an aging population mean for housing markets, healthcare demands, retail planning, and community infrastructure? To answer those questions, we need to look beyond national averages and examine where the aging trend is accelerating the fastest.
Between 2020 and 2025, many of the regions experiencing the steepest increases in median age are well-known retirement destinations — places where warm weather, amenities, and affordability attract older adults.
Among all U.S. metros, Wildwood–The Villages, FL stands out dramatically, with a projected median age nearing 67 years in 2025. More than 57% of its population is 65+, and a remarkable 30% are 75+. Other metros tell a similar story. Notably, 17 of the top 25 markets are in Florida, Arizona, or along coastal retirement corridors. Several others sit in scenic western and Appalachian communities.
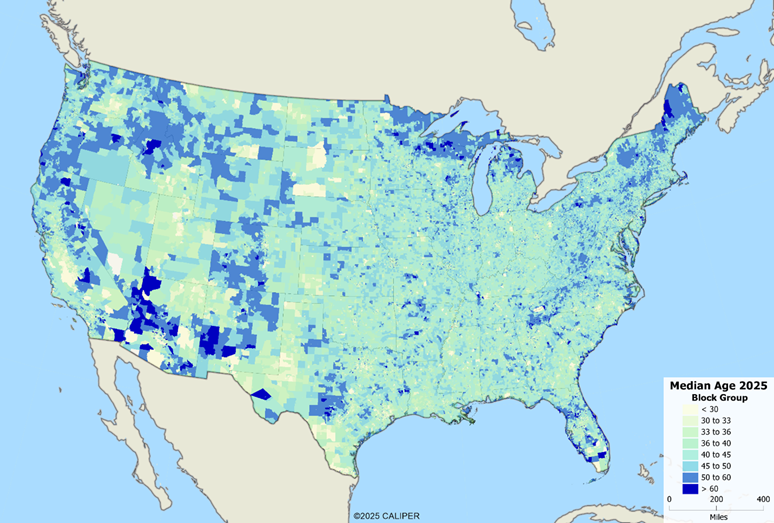
When comparing 2000 vs. 2025 median age by block group, a clear pattern emerges:
- Mountain West regions have seen substantial aging — especially in Montana, Wyoming, Idaho, and Colorado high-country communities.
- Appalachia has aged significantly, as have northern Minnesota, Michigan, and much of Maine.
- Much of the rural interior is older today than at the turn of the millennium.
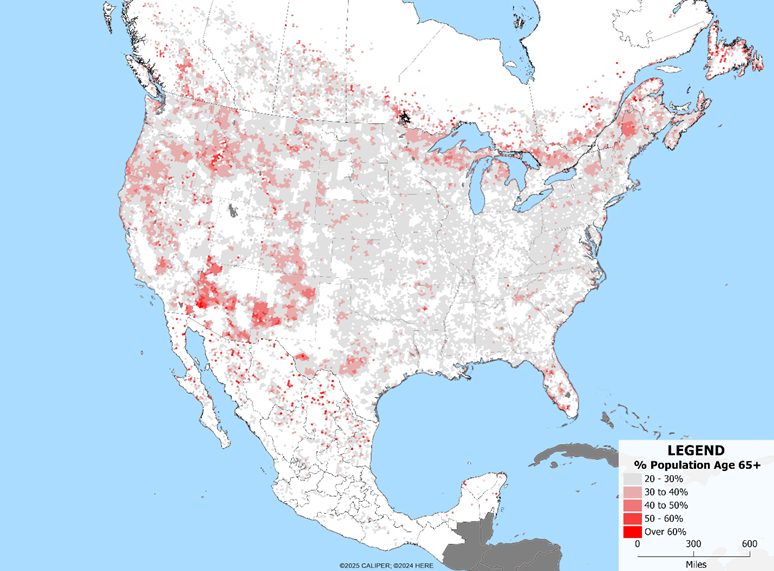
One particularly striking visualization appears when viewing North America together:
a band of older populations stretches from northern Minnesota/Wisconsin/Michigan, through Ontario, into Upstate New York and northern New England.
In contrast, Mexico shows only pockets of higher age in northern rural areas where younger residents have left, but the country overall remains nearly a decade younger than the U.S. and Canada.
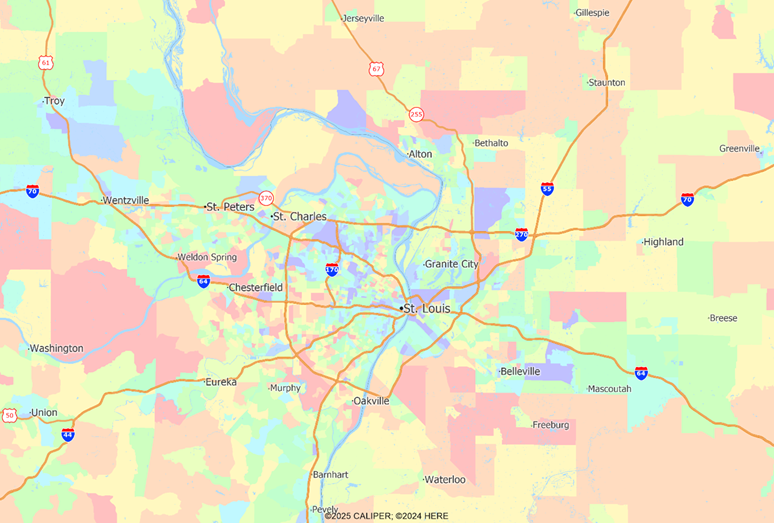
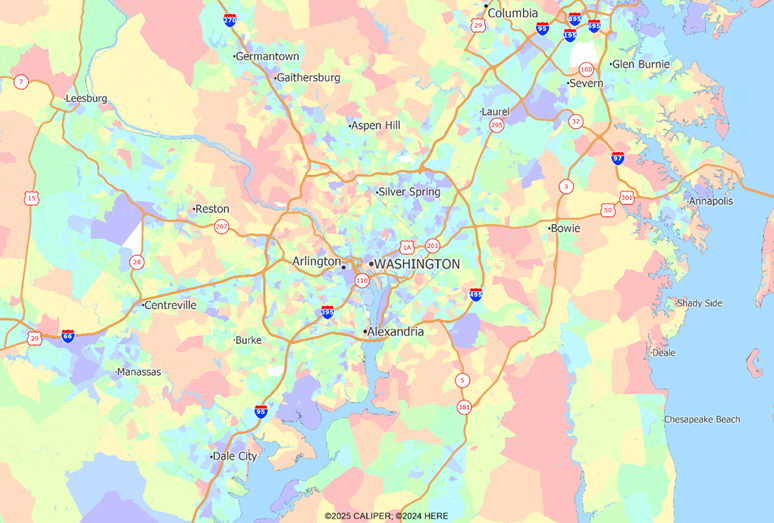
Urban age structure has fundamentally reversed over the last half-century. In the 1950’s and 60’s, young families left cities for new freeway-connected suburbs. Inner cities aged as older adults remained and housing affordability shaped mobility. Today, younger residents are living in central city neighborhoods, while traditional “beltway” suburbs are aging rapidly. Many of these suburbs were built for boomer-era families who haven’t moved. Newer outer suburban growth zones are trending younger, attracting families with new build homes and community amenities.
These shifts have real planning implications. First, communities built for children now need services for seniors. Parks become walking trails, schools become adult centers, and transit demand increases for healthcare access rather than daily commuting.
Meanwhile, city cores face the opposite challenge. After decades of under-utilization, many urban school districts — particularly in affluent areas — are experiencing capacity pressure from young families returning.
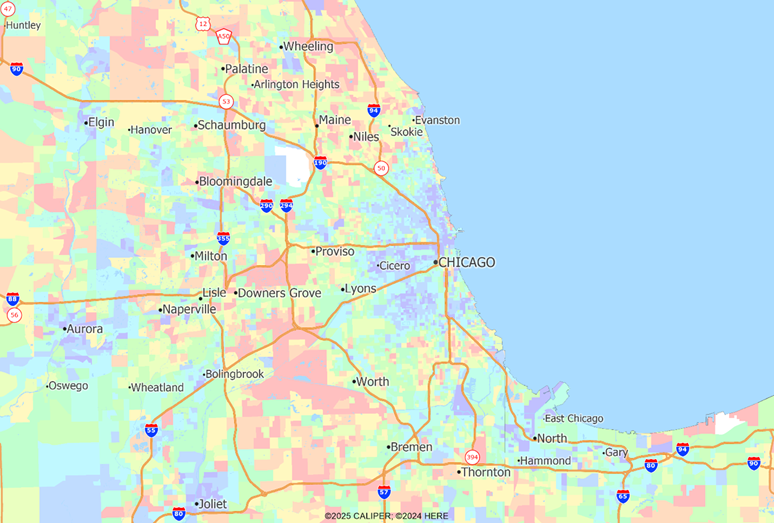
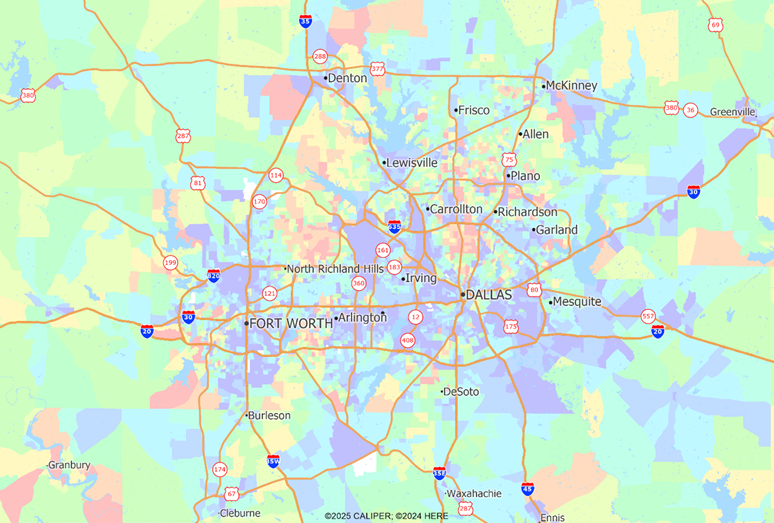
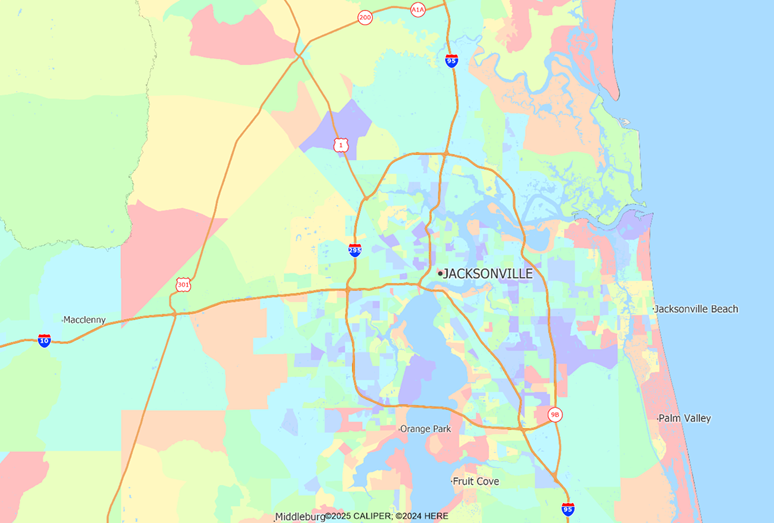
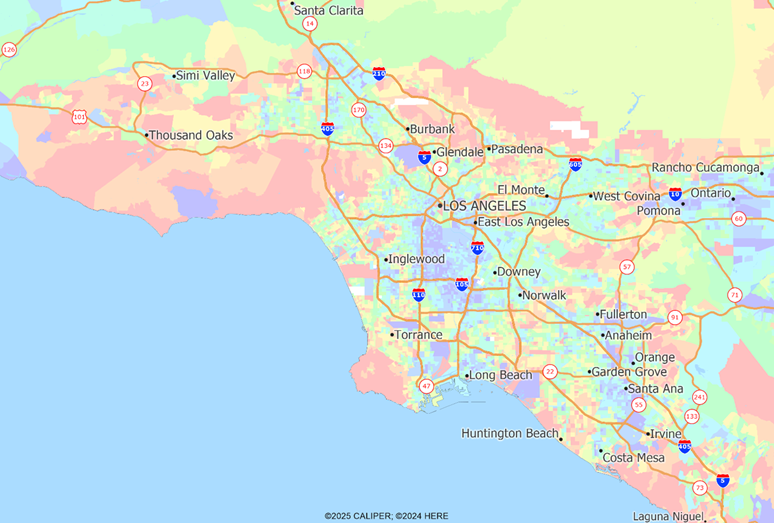
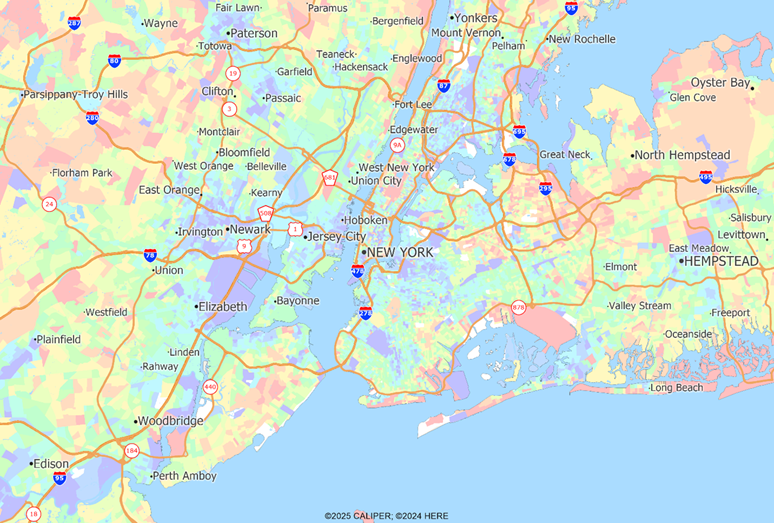
Dallas/Fort Worth is an outlier, where continued rapid growth has masked aging in older suburbs, creating more mixed-age patterns. The following series of maps show Chicago, Dallas, Jacksonville, Los Angeles, New York, St. Louis, and Washington D.C., with red areas showing aging populations, and blue showing younger populations.
Understanding age distribution isn’t just a demographic exercise — it’s strategy. Everything from healthcare, retirement services, housing, retail and public infrastructure all rely on understanding the age of their population to have the best opportunity for success.