In Mexico, a complete census of the population is undertaken every ten years by the Instituto Nacional de Estadistica y Geografia, or in English, the National Institute of Statistics and Geography (INEGI). We of course greatly appreciate the explicit shout out to geography here.
Mexico, officially the United Mexican States, is a federal republic consisting of 31 states plus a federal district covering the capital Mexico City. The county equivalent geography is the Municipio, which very much appears to be a hybrid between city and county government as practiced in the US. Nationwide, there are 2,478 such units, and these encompass the entire national territory.
Below this level, there is no nationwide coverage. And here is where the Chex mix comes in. The locality level consists of two main groups – rural and urban. In urban areas, the localities are further divided into a unit known as an AGEB (Areas Geostadisticas Basicas), which are mappable as areas. These are very similar to the US block group or Canadian dissemination area in terms of scale, but they are only defined in urban areas. Blocks, or manzanas, are defined but are rarely useful because of the privacy protection scheme used by INEGI, which simply suppresses all values – including population – in manzanas which fail to exceed a minimum threshold.
This leaves rural areas, which are not fully mapped and are represented only as a latitude/longitude coordinate pair. These can be just a single inhabited farm or ranch, a hamlet, or simply a collection of houses built in close proximity. In the United States or Canada, representing rural populations as points would be highly inaccurate, given that the settlement patterns were based on the allocation of large farm acreage to individual families. Meanwhile, the Spanish form tended towards large land holdings (ranchos) where the landowner would usually build a hamlet where the workers on the ranch could be housed. In most areas of Mexico, given both the generally mountainous topography and the land distribution scheme, there really are no people permanently living in areas not covered by the localities.
Our approach is to at least attempt to identify the spatial extent of those localities by analyzing building footprints. By finding the convex hull of the vertices of the footprint polygons, then adding a small buffer, we can represent these points quite accurately as polygons, an example of which appears below. In the first image, we have only the locality centroid:

We add to this image the outlines of several buildings, and given that this is an isolated area, and there are no other localities in the vicinity, we create from this a local boundary:
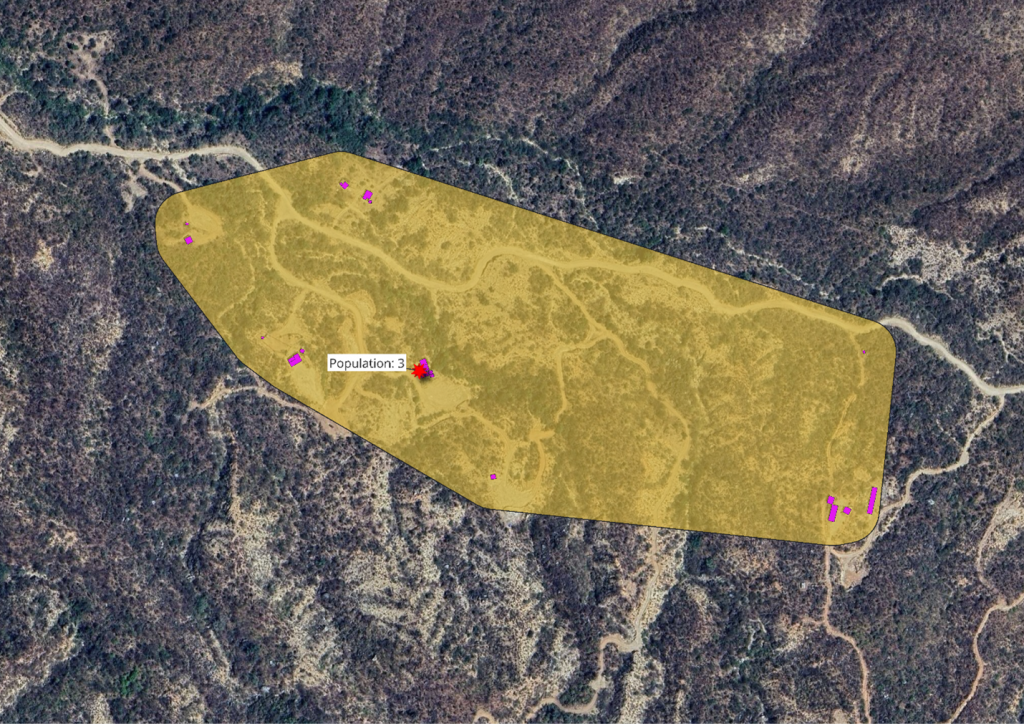
The result is a set of rural locality polygons which actually represent the location of the population, rather than attempting to fill in the empty spaces, which can be misleading when looking at population density maps.
The initial geography content for our upcoming release for Mexico consists of:
Administrative Areas:
MX Mexico (national)
ST State
MU Municipo
Statistical Areas:
LO Locality
AG AGEP and rural localities
Hexagons:
H3 H3 hexagons, level 3
H4 H3 hexagons, level 4
H5 H3 hexagons, level 5
H6 H3 hexagons, level 6
H7 H3 hexagons, level 7