Late last year, the census estimate jumped by over 4 million people. Over the past few years, news reports have indicated that more than two million people have crossed the southern border annually. The Census Bureau has the capacity to incorporate these figures into its national and state-level estimates. However, major revisions have been made only three times in recent years, each occurring in the month following a national election. But where are these people living, and how are we integrating them into this next release?
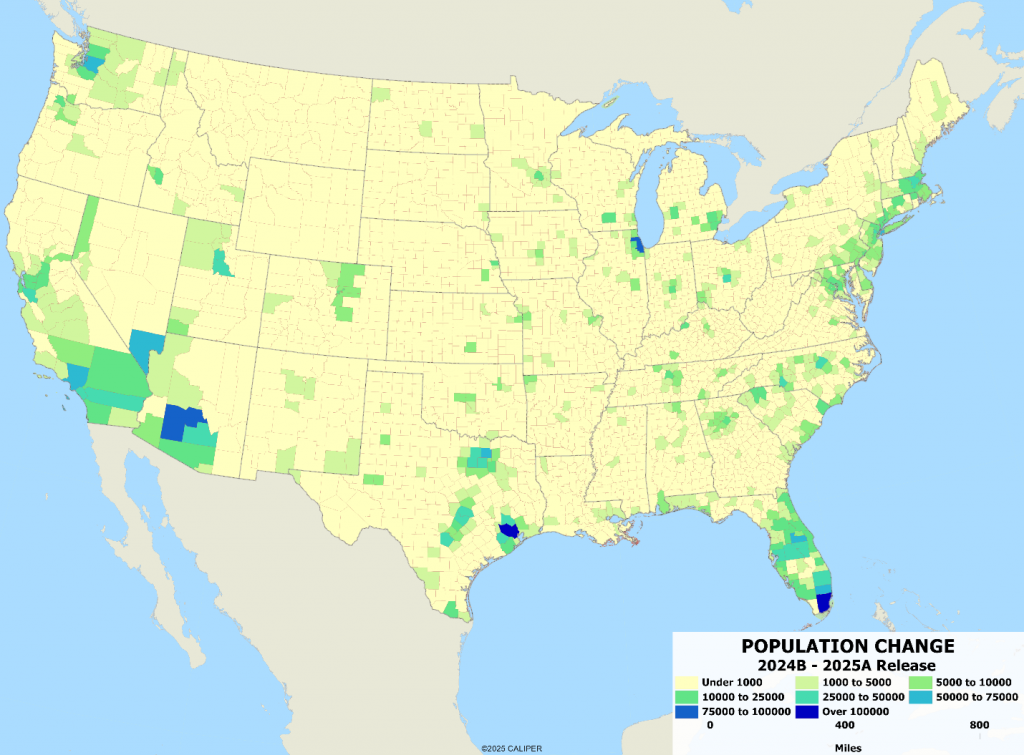
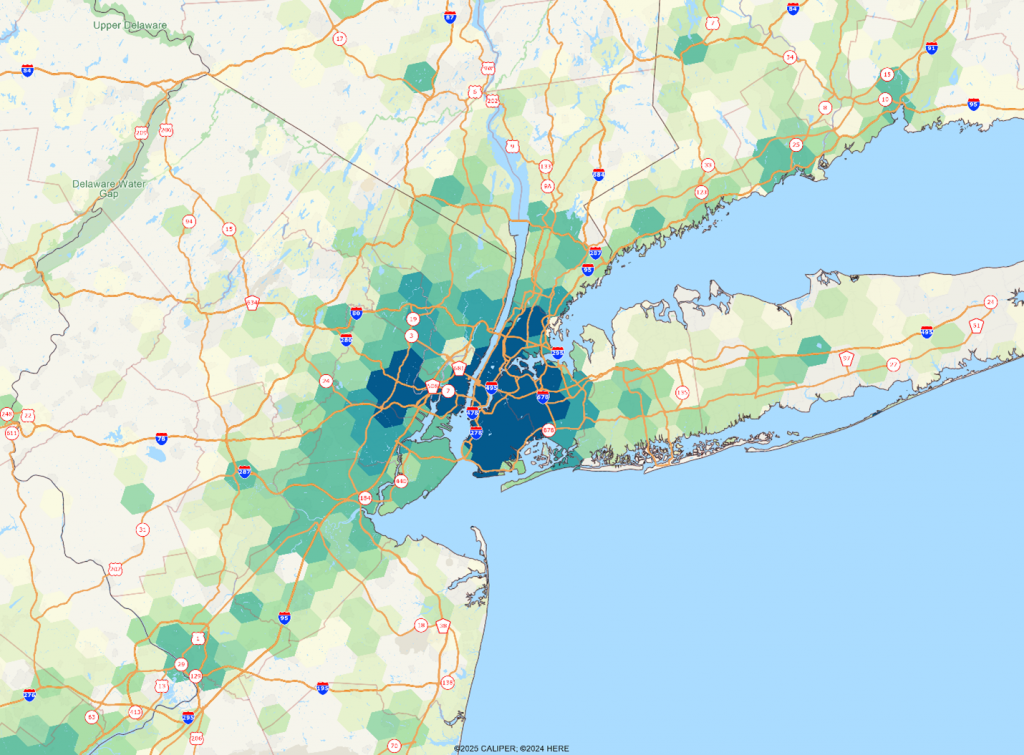
At the county level, these added people will be following along with recent census changes. Several counties added well over 100,000 people to the previous census estimates. The largest areas include southern California, Phoenix-Tucson, the Texas triangle, Chicago, New York city, and much of central and coastal Florida, especially the Miami area. The map below shows the change on a national level from our 2024B release in the fall to the 2025A release, coming this month.
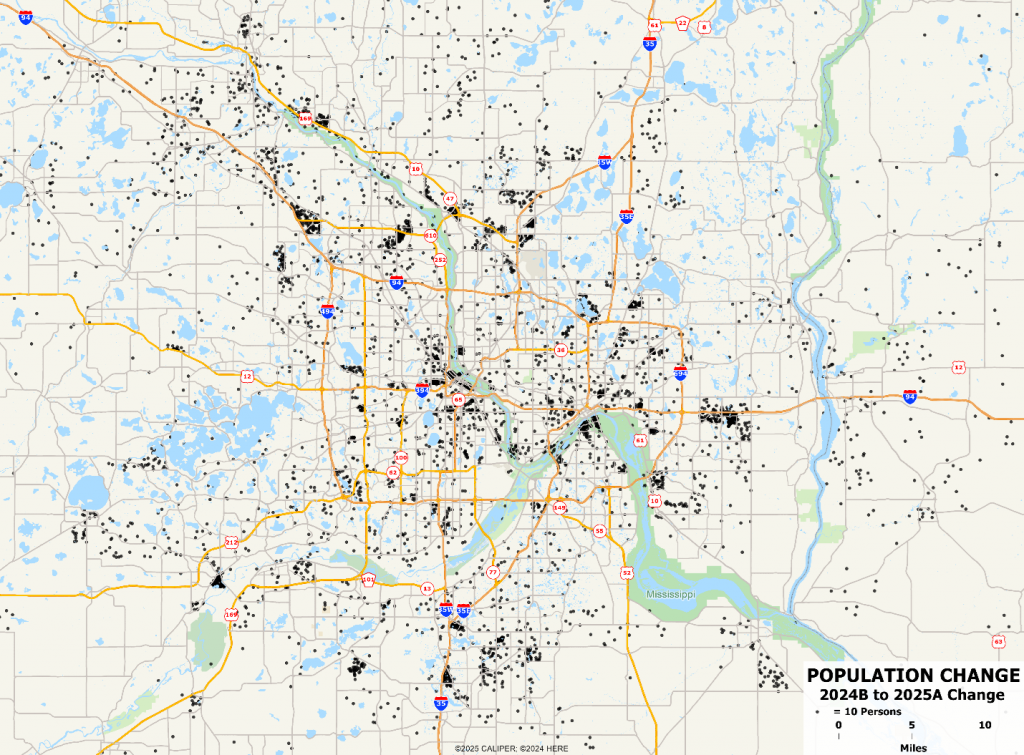
So, let’s take a look at a few metro areas – where growth is most often concentrated rather than equally distributed. The new residents of Minneapolis-St. Paul are dispersed around the metro area, but they cluster together in neighborhoods.
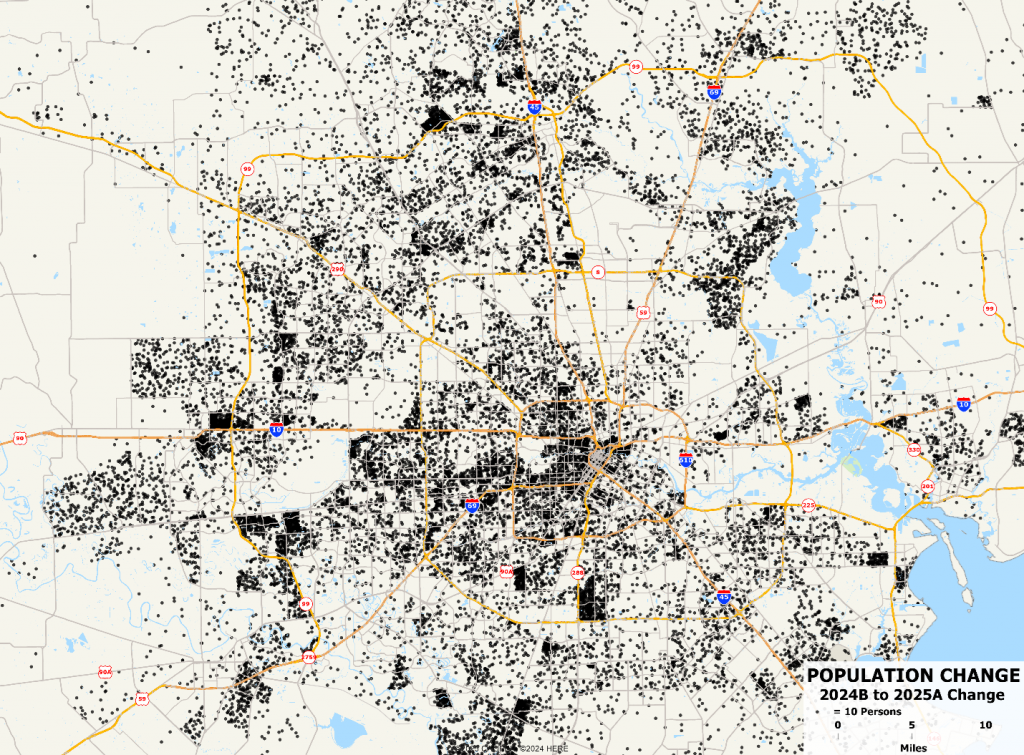
Note the much greater concentration in Houston than Minneapolis-St. Paul above, but even then, some areas have been impacted little, while in Houston there are block groups whose estimated population we have doubled.
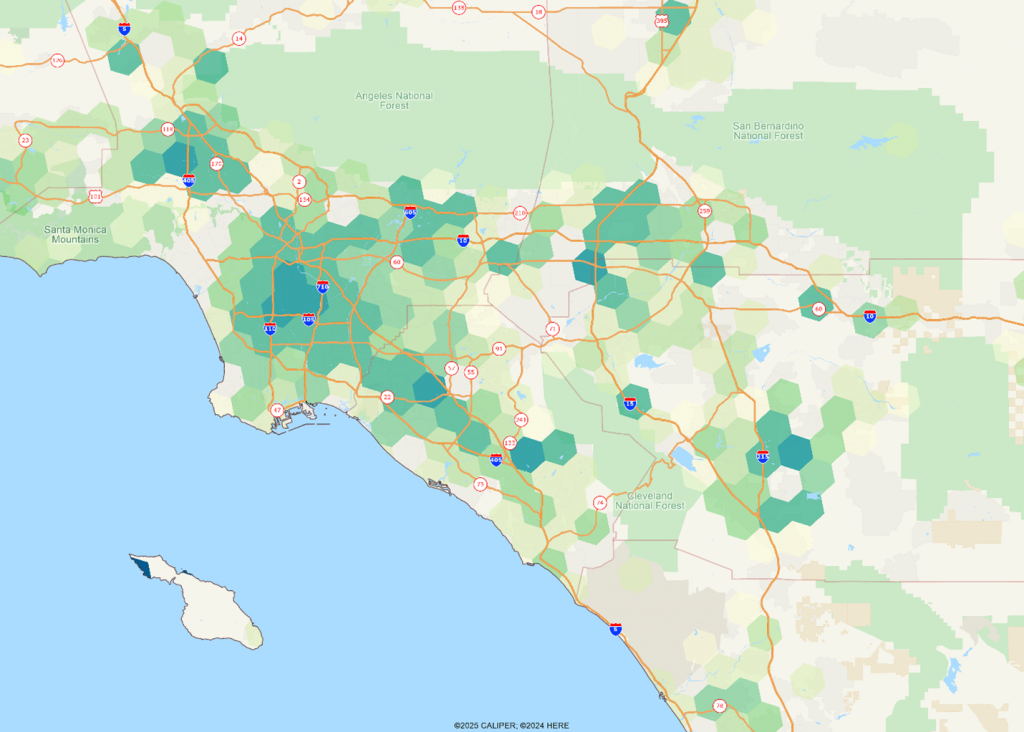
Using level 6 hex grids, we looked at several areas.
Note that in Los Angeles, absent this massive immigration, we would have expected a decline in population in most areas of the city.
In New York City, these new residents are heavily concentrated in the five boroughs and selected parts of nearby New Jersey.
So how did the Census have it so wrong? Over 4 million people, somehow not included in national and state estimates? Obviously partly political, but they rely on the ACS for much of their annual city and county estimates. Everyone knew that the numbers were very low, as we talked about before – but they hid behind the ACS not showing it. DHS admits to at least 10 million illegal immigrants mainly coming over the southern border over just a four year period. So where did they go? Our understanding is that the initial county numbers the census released included data from DHS – using the mobile apps that were installed on many phones, records from the many flights of immigrants into cities from Seattle to Miami and everywhere in between. Some demographic estimates? They will just recalculate the average household size by block group – so every block group will add people. If you track change from the release of other data providers prior to the change and the current release, and you see most areas have roughly the same percentage growth, you know that no significant effort was put into finding where these people really are.
The impact has not yet been seen in the housing markets in terms of a growth in dwellings, which makes tracking much more difficult – many are living in non-official group quarters – long term hotels, etc., while most are likely living with relatives or friends. So, the housing impact has been low, but we did pay attention to vacant housing at the local level, especially since those numbers crept up over COVID. We also paid attention to things like language spoken in geographic areas. Immigrants, especially non-English speaking ones, will tend to seek out people who speak their language – so in part we looked at the existing ancestral / ethnic breakdowns as being more likely to have absorbed some of the immigrant populations.
Over the next year or so, we expect these estimates to improve as the census bureau adapts their estimates, especially the ACS, using the non-standard data from the DHS. Also, our dwelling/parcel databases will increasingly be used to identify new dwelling units.