Talk to friends, watch the news, or log into your favorite social media app, and it’s hard to not hear the chatter about the price of groceries, especially eggs. Sure, everything is more expensive than ever before, and where you often feel it is in your everyday living expenses. As a result, food insecurity is up across the country, even amongst employed Americans, according to Feeding America, a non-profit that combats hunger in America. Where in the U.S. does grocery spending account for the highest percentage of disposable income?
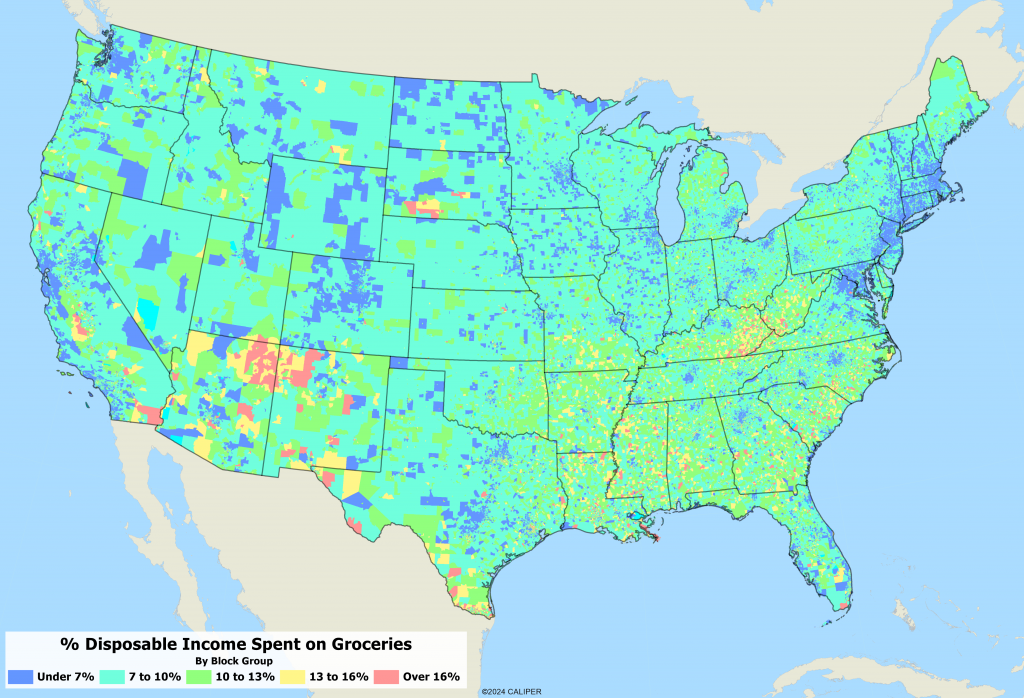
Using our new disposable income models, (which you can read more about here), and our new consumer expenditure models (which you can read more about here), we took the Average Household Grocery expenditures (XCYGRO) divided by Average disposable household income (that is, income AFTER taxes and SSI payments), and created a model to look at grocery spending. Note that this does not include the major programs, like SNAP and WIC, which are meant to alleviate poverty and aid in grocery spending for low-income families. The map below shows the percentage of disposable income spent on groceries, and as you can see from the map below, Native American reservations are some of the hardest hit areas in the country.
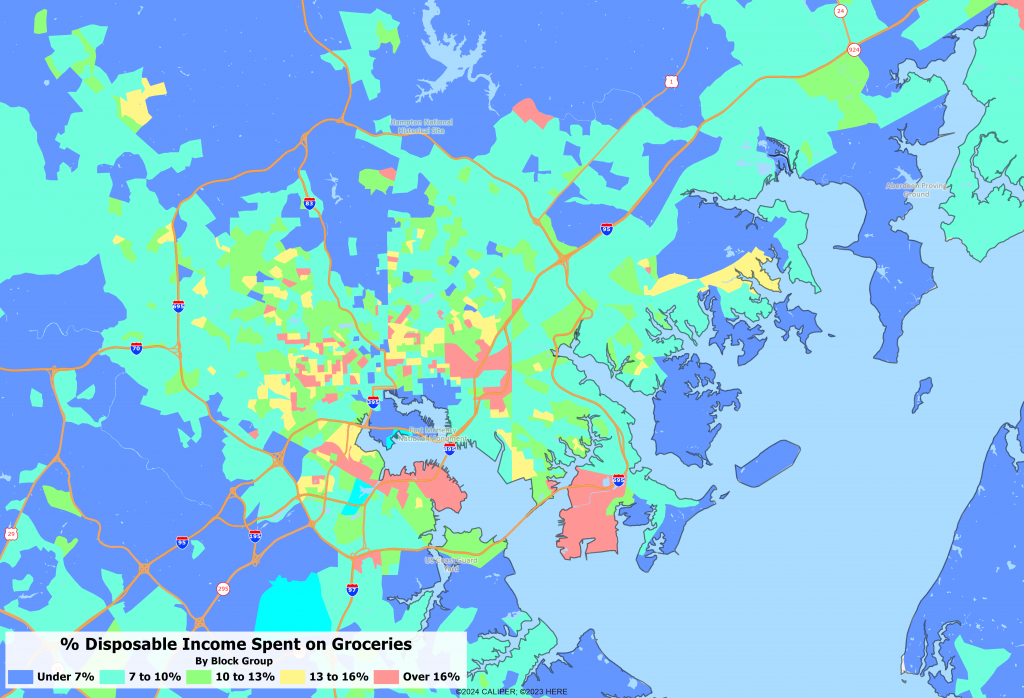
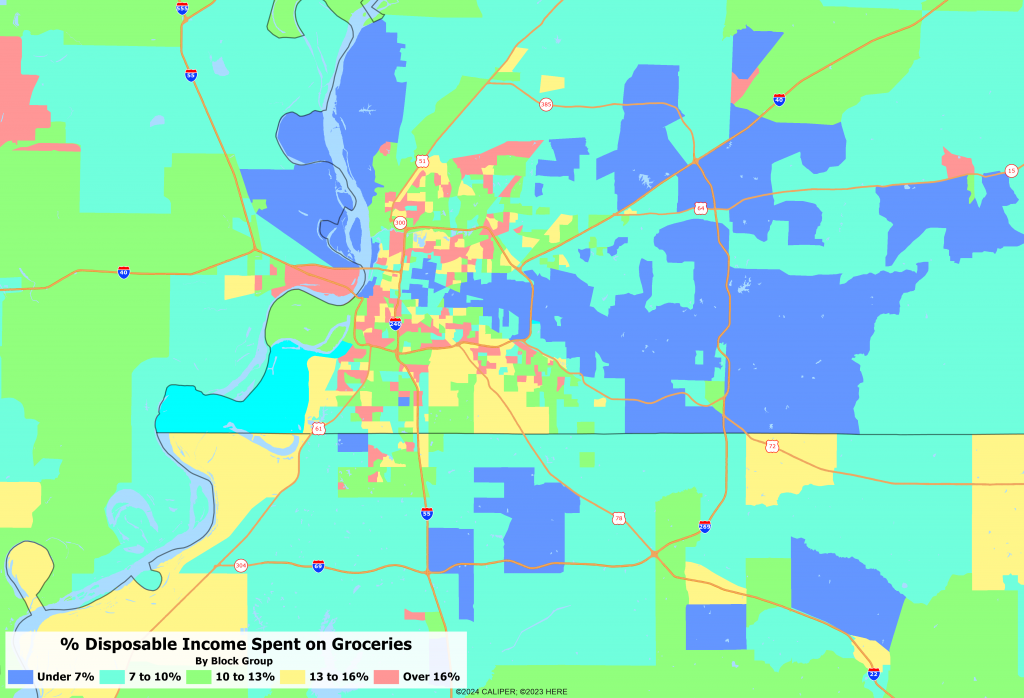
When you look at the data at a city level, there are interesting patterns that emerge, even more dramatic than the national map would suggest. Below we have mapped Baltimore and Memphis, both of which show distinct neighborhood discrepancies in income and spending.
High grocery prices are likely not going anywhere, and unless wages keep up with inflation, more Americans could see the percentage of their budgets spent on food increase. As a result, other disposable income spending could be reduced in household budgets, or more Americans could find themselves relying on debt or government programs to make ends meet.