For many years, one of the primary complaints that we have heard about small area consumer spending models, from any of the major data vendors, is a lack of variance. Look at the percent of total expenditures at the block group spent on any category, and there is much less variation than expected.
We have long suspected that the problem is that we are modeling at the wrong level. Models built for block or block group areas tend to water down the variation which we know is there but can’t capture. The AGS synthetic household model provides a mechanism that allows us to model at the level where decisions are made – the household.
This major overhaul of a key database utilizes an extensive analysis of the raw household level diary and interview files from the latest two consumer expenditure survey years using a sophisticated three-tiered set of models that balances to the CEX survey topline averages while preserving the maximum amount of local variation possible.
The three tiers together consist of over five hundred individual statistical models that use multiple techniques that include both linear and logistic regressions, which were computed at the household level. Households were then aggregated into our standard geographic base – the census block. The initial results were then summarized and harmonized with the topline group level survey totals, and differentially inflated to match current price levels.
It is for small areas, like block groups or trade areas, where the impacts of this model are most felt. Each variable was computed as a proportion of total expenditure then analyzed at the block group level. The variability of the new dataset (measured as a coefficient of variation) is nearly three times that of the existing dataset – meaning that we have managed to capture the nuances of household spending far better than any previous models.
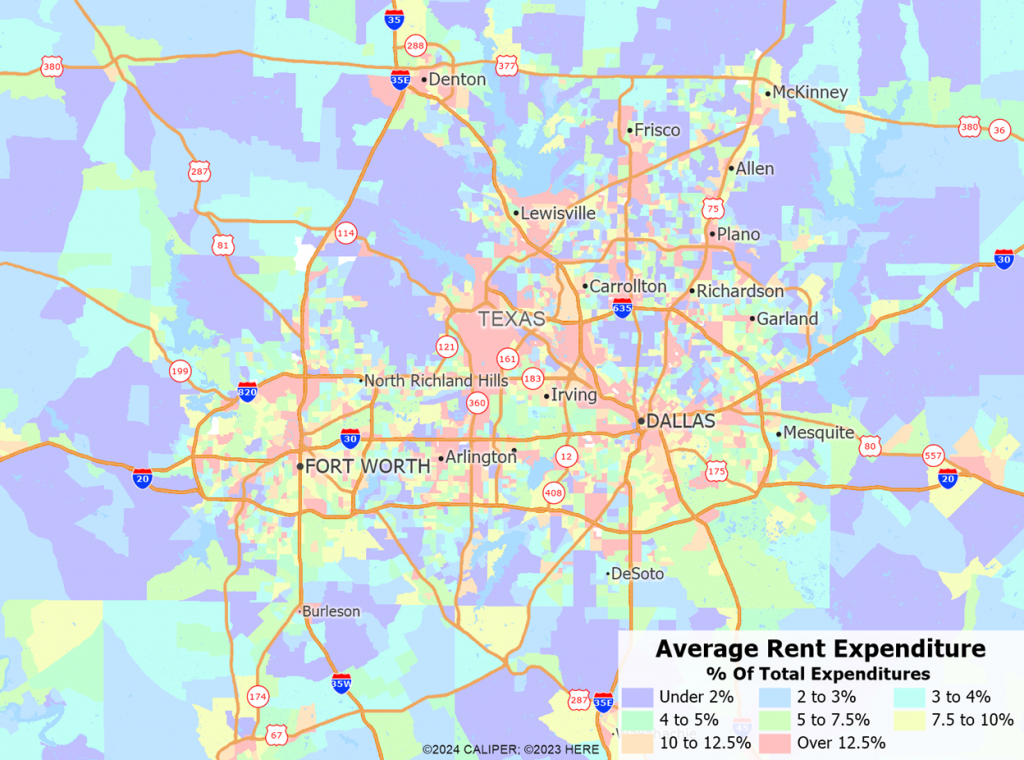
How does this look on the ground? The results are native at the census block level which gives an unprecedented and detailed view of spending patterns. Equally importantly, the model captures the differences in the distribution of expenditures that previous models tended to minimize.
In the course of building the new models, we made several changes to the individual variables. In some cases, we collapsed some of the smaller, highly detailed categories to streamline reports, especially where technological changes have rendered some categories almost meaningless. We also moved gift purchases under their appropriate major category since many users were not considering these as part of the demand for a product type – a good example is gifts of infant clothing, which is a significant component of expenditure. These categories are now found and utilized more easily. Finally, we have added some new categories including –
- More detailed information on contributions, now by type (religious, political, etc.)
- Social security and retirement plan contributions
- Breakdowns on meals away from home to include both meal type (e.g. breakfast, dinner) and restaurant type (e.g. fast food, fine dining)