This week, Apple held their annual keynote event and announced the latest release of iPhone 16 and 16 Max. Nationwide, it is no secret who is winning the iPhone versus Android (Google phone) competition. Using our Behaviors and Attitudes database, we know that there are about 2.7 Apple users for any Android user. So, who is most likely to be an Android user? We break down the data using our neighborhood segmentation system, Panorama.
A key to this discussion is likely the cost of the phones. The iPhone can be significantly more expensive than a Google Android phone, depending on the phone you could save a few hundred dollars by choosing an Android, and many cell phone carriers offer free phone deals to get an Android. While they are never the minority, Android phones do best in Panorama segments that tend to be lower income, including segments Middle America (38), Simply Southern (47), Forgotten Towns (65), Better Times Past (66) and Southern Discomfort (64). Conversely, Apple is most dominant in affluent segments, such as One Percenters (01), Second City Achievers (03), Hipsters and Geeks (25), Sprawl Success (04) and Peak Performers (02).
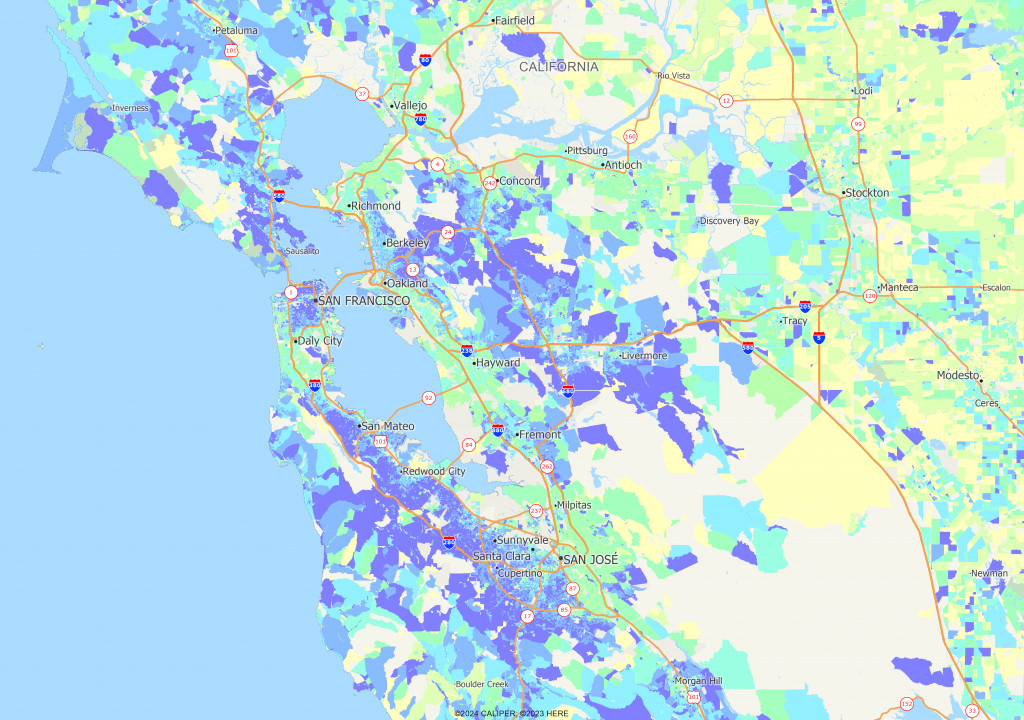
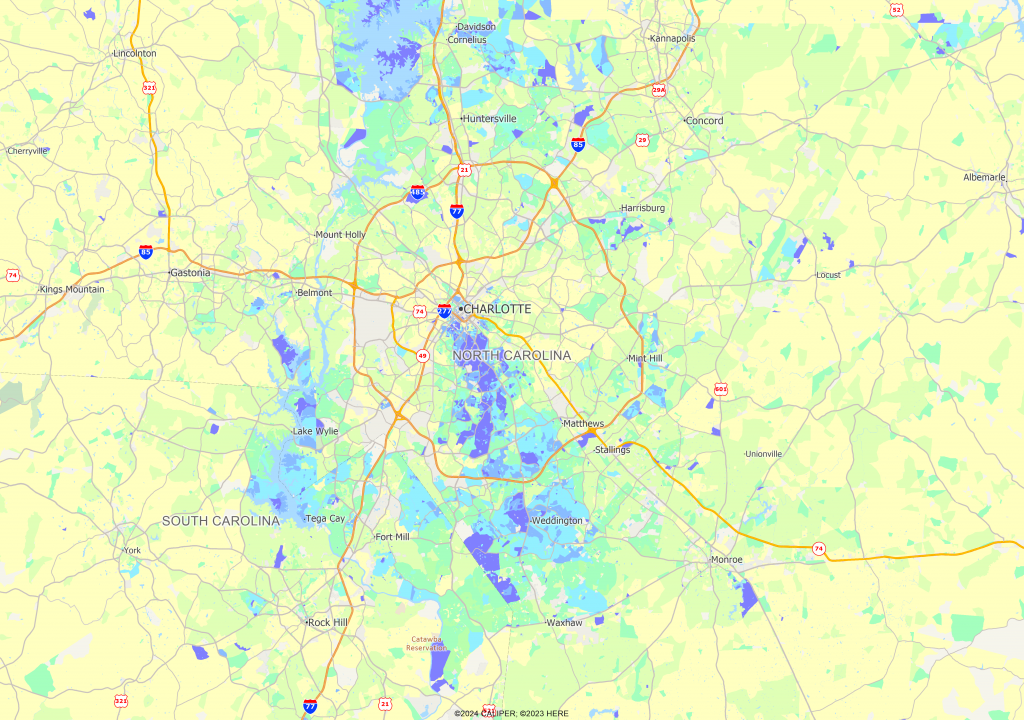
While every segment is heavier on Apple users, we mapped two metropolitan areas, Charlotte NC and San Francisco to see where these differences are apparent. On both maps, blue shows Apple dominance, and yellow shows areas where there are less Apple users. On both maps, you can see that rural areas are less Apple oriented, and in urban areas, less affluent areas tend to have a higher proportion of Android (Google) users.
Whether you choose iPhone or Android, it seems that a large portion of the decision comes down to the cost of the new phone. Affordability becomes more important during time of inflation, which likely accounts for part of Apple’s current earning shortcomings. Time will tell if the latest release helps with their sales goals.