
Demographic change is generally slow moving, except in times of crisis. This is especially true at the national level but is also often true of small areas. Change is generally best considered as two separate components:
- Gradual change, such as the impacts of declining birth rates on a population, which tend to occur over decades
- Abrupt or catastrophic (mathematically speaking) changes. For small areas, these can occur with alarming frequency – a plant closure, office consolidation because of mergers, changes in taxation policy, hurricanes, and more recently, local variations in public health response can all greatly change the local demographics
Gradual changes are amenable to forecasting while abrupt changes are rarely accounted for in advance. These are often called ‘black swan’ events, and the period from 2019 to 2023 included not one but several such simultaneous events:
- COVID19 clearly had an impact everywhere, but the spatial distribution of the impact’s severity was dependent upon the joint response of multiple layers of governmental jurisdictions
- Abrupt reversals on many federal policies in the energy and transportation sectors
- General societal unresent combined with changes in attitudes towards policing and criminal justice resulted in an urban flight from some cities not seen in decades as a result of increasing crime rates
We looked at census tract population change pre-COVID (2010-2019) and during the COVID period (2019-2023) by first converting data to the 2020 census base, then classifying population change as percentiles then comparing the change in percentile between the two periods. Pre-COVID patterns were a combination of long-established trends – rural and small town depopulation, suburbanization, the economic rise of the southeastern states, and small but increasing share of remote employment.
The map shows areas in dark red which had a major increase in growth percentile, with dark blue showing large decreases. Many areas shifted dramatically from growth to population decline, or the opposite – in some cases reversing multi-decadal trends:
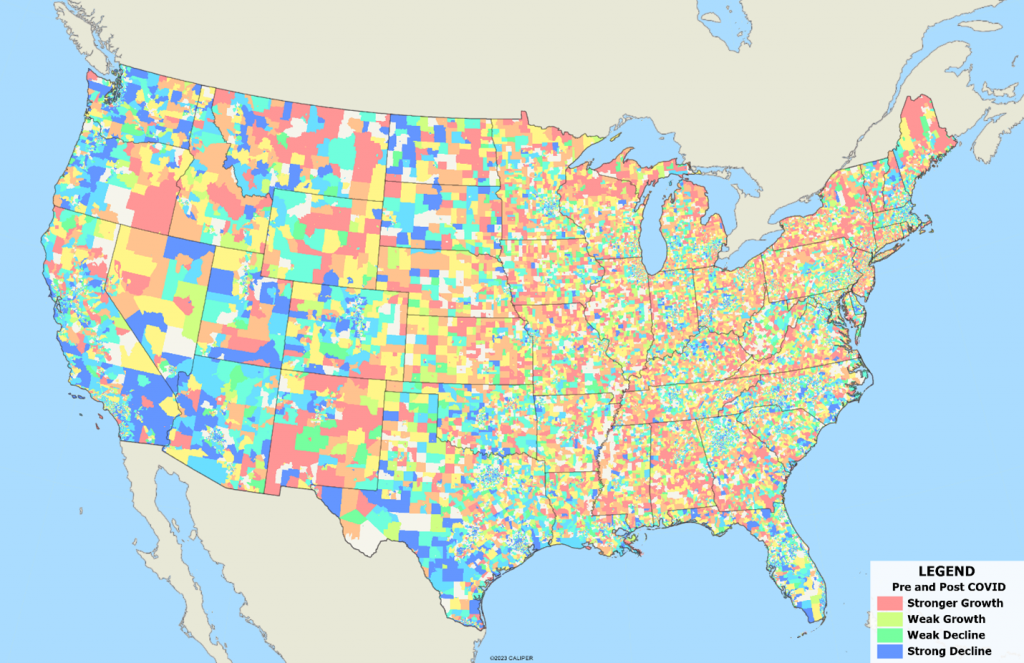
Among the major changes we can identify even on a national scale map include:
- The sudden drop in population in the oil producing areas from Texas to the Dakotas. The abrupt change in federal policies had an immediate and substantial impact on towns like Midland and Odessa in Texas and on the western part of North Dakota anchored by Williston. This had little to do with the epidemic and was largely a result of shifts in DOE policies towards exploration and has resulted in skyrocketing vacant dwelling rates.
- The decline of much of urban California reversed a century old trend. Restrictive rules imposed during the epidemic pushed many administrative workers to work from home, often at vacation properties located well outside the cities. Combine this with the reforms to California laws which have resulted in substantially increased crime rates, and the result has been that many of those workers have simply not returned to the office, and many have simply left the state entirely.
- Growth in rural areas not seen in decades in selected areas as diverse as rural Alabama to upstate New York, usually within a reasonable drive of a major metropolitan area.
- At the same time, many of the rapidly growing metropolitan areas pre-COVID continued to grow, such as Nashville, TN, and many areas of Florida. In these areas, change wasn’t abrupt, just accelerated.
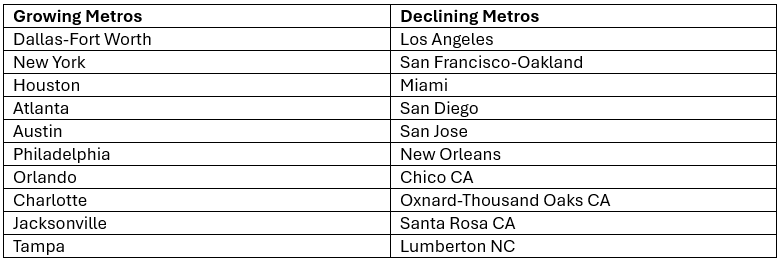
At a metropolitan level, the biggest ‘winners’ and ‘losers’ in terms of absolute population change between 2019 and 2023 were:
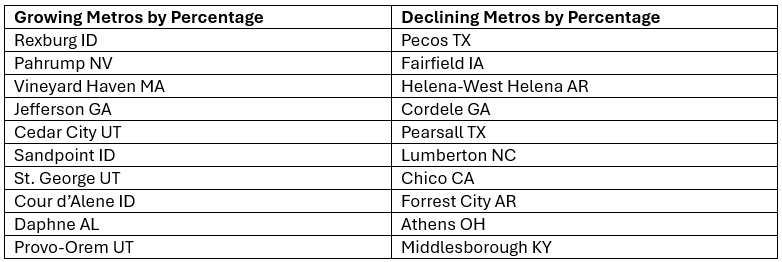
Not surprisingly, on a percentage basis, the list is radically different and reflects the joint effects of gradual and abrupt change. Pecos, Texas declined by a whopping 20% in just four short years!
Abrupt, or ‘catastrophic’, changes are well understood mathematically. There are usually two distinct patterns of response. One is a return to the patterns which existed prior to the shock to the system, the other is a return to stability or equilibrium but on a different level than before. It is too early to tell whether things will return to ‘normal’ or simply find new equilibrium points. There are two main questions long term:
- Will the shift towards working at home continue from its current levels (over 20%) or resume after returning to the pre-COVID levels (around 8%). While it has already begun dropping, it is too early to tell if it will simply stabilize at a higher level or return to pre-COVID levels.
- Will the potential of a new president in November reverse the energy policies of the current administration? These have always been boom and bust areas, so if there is a reversal, expect the repopulation of these towns to proceed quickly.
A final note, these kinds of abrupt changes – especially decline – can affect the accuracy of current estimates quite dramatically. For example, a methodology which relies heavily on postal changes (e.g. new ZIP+4 codes) will perform poorly in declining areas, since they rarely remove or consolidate delivery zones. A robust estimates methodology must be able to handle decline by understanding and incorporating housing vacancy levels.

Recent Comments