Recently, we read a post on LinkedIn which, if we are honest, was really annoying to us. The post was entitled “Impact of Political Affiliation on College Enrollment Trends” (https://www.linkedin.com/posts/gad-levanon-3b9b933_college-enrollment-highereducation-activity-7150855871676215296-aorX?utm_source=share&utm_medium=member_desktop). It was a brief post which make some substantial arguments:
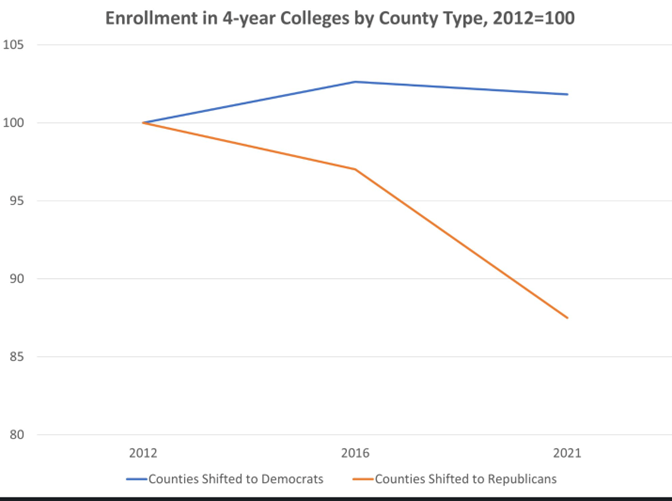
“Using data from Integrated Postsecondary Education Data System, and county voting data, they created the data for the chart below. The chart shows that colleges and universities in counties that shifted towards Republicans in presidential elections between 2012 and 2020, experienced a significant decline in enrollment. That was not the case in counties that shifted to democrats. In regression analysis the results hold even after controlling for county characteristics.
The results are not entirely surprising given the growing evidence of skepticism and hostility of many Republican voters towards higher education.
This trend could lead to a vicious cycle that will increase geographical inequality and political polarization. People in areas that are left behind are less likely to go to college which in turn, will make these regions fall behind even further.”
The post was accompanied by a chart that shows that counties which trended towards Republican had substantial losses in college enrollment:

The comments made were equally disturbing to us, as they simply seemed to buy into the argument and quickly move to further illogical conclusions:
“Perhaps one side of the political equation benefits from a less educated populace and understands this, thus rails against the perceived bogeyman of education to their political benefit”
“It would be interesting to see how crime rates track these trends. Generally, one expects that lower education levels that produce lower economic advancement, result in higher crime rates.”
It is not our intent to engage in political debate, as our focus is on the logical fallacies inherent in the authors’ argument: that shifts to the political left or right at a county level have a causal effect on the enrollment of students (who, in most cases, are not part of the voting population). To be fair, we couldn’t find the entire paper, and could be that the post doesn’t accurately reflect the article itself.
The basic logic, most unstated, is that Republican voters are less likely to have college degrees, so that when a county shifts towards them, that fewer students will be enrolled in college because their parents don’t value higher education.
In most counties, the margin of victory of one party over another is under 10%, and the assumption is that individual families where one or more of the parents shifted their vote are the very same ones who decided not to send their children to college. Could it be true? Sure, but this data doesn’t tell you that. Worse than that, the assumption is of a closed system, that students must attend college in their home county or not at all. Further, note that it wasn’t which party was the majority winner in the county, it was the change in the vote one election to the next, inferring again that it is the marginal Republican voter who is clearly not sending their child to college. What about the family who didn’t vote and yet didn’t send their kid to college?
We are reminded of one of the original studies that pretty much every quantitative geography grad student was asked to read by Emile Durkheim in 1899 that looked at suicide rates in Europe by country. This study discovered that countries which were predominantly Protestant had higher suicide rates than Catholic countries. The conclusion was that individual protestants have higher suicide rates than Catholics, which is on its face absurd.
This paper, sadly, presents an equally absurd conclusion based on the change in the votes (which is always a subset of the adult population) which was applied to a completely different population (enrolled college students in the same county) with a conclusion that individuals in the first group caused the individuals in the second group to change their behavior as a result of the shift in voter preferences.
As I have always said, let me take the data down to the dungeon, and I will bend it and torture it until it tells you what you want to hear.
