
Most site report systems include at least one report that takes multiple pages and presents users with the full range of demographics covered. Users are expected to delve into a ten page report, looking for the key attributes that define the area. There are two main problems with this approach –
- How does a user know when a variable is sufficiently different from the average to merit discussion or further consideration?
- We know from years of experience that most users look at the population figure, the median household income, and scan through the numbers with less and less attention with every page.
For years, most systems have allowed users to define a comparison benchmark – such as the state where the site is located or perhaps the national average. This should help users decide what variables are important, but the reality is that it makes the second problem much worse by doubling the number of statistics that must be reviewed.
What if a report was available that compared hundreds of variables across millions of trade areas to determine which are unusual and should be highlighted? We selected nearly six hundred variables and for each created a model that identifies unusual values based on the relative size of the trade area. The EXS (Executive Summary) report does the dirty work of wading through that ten page report and picking out the extreme values – both high and low.
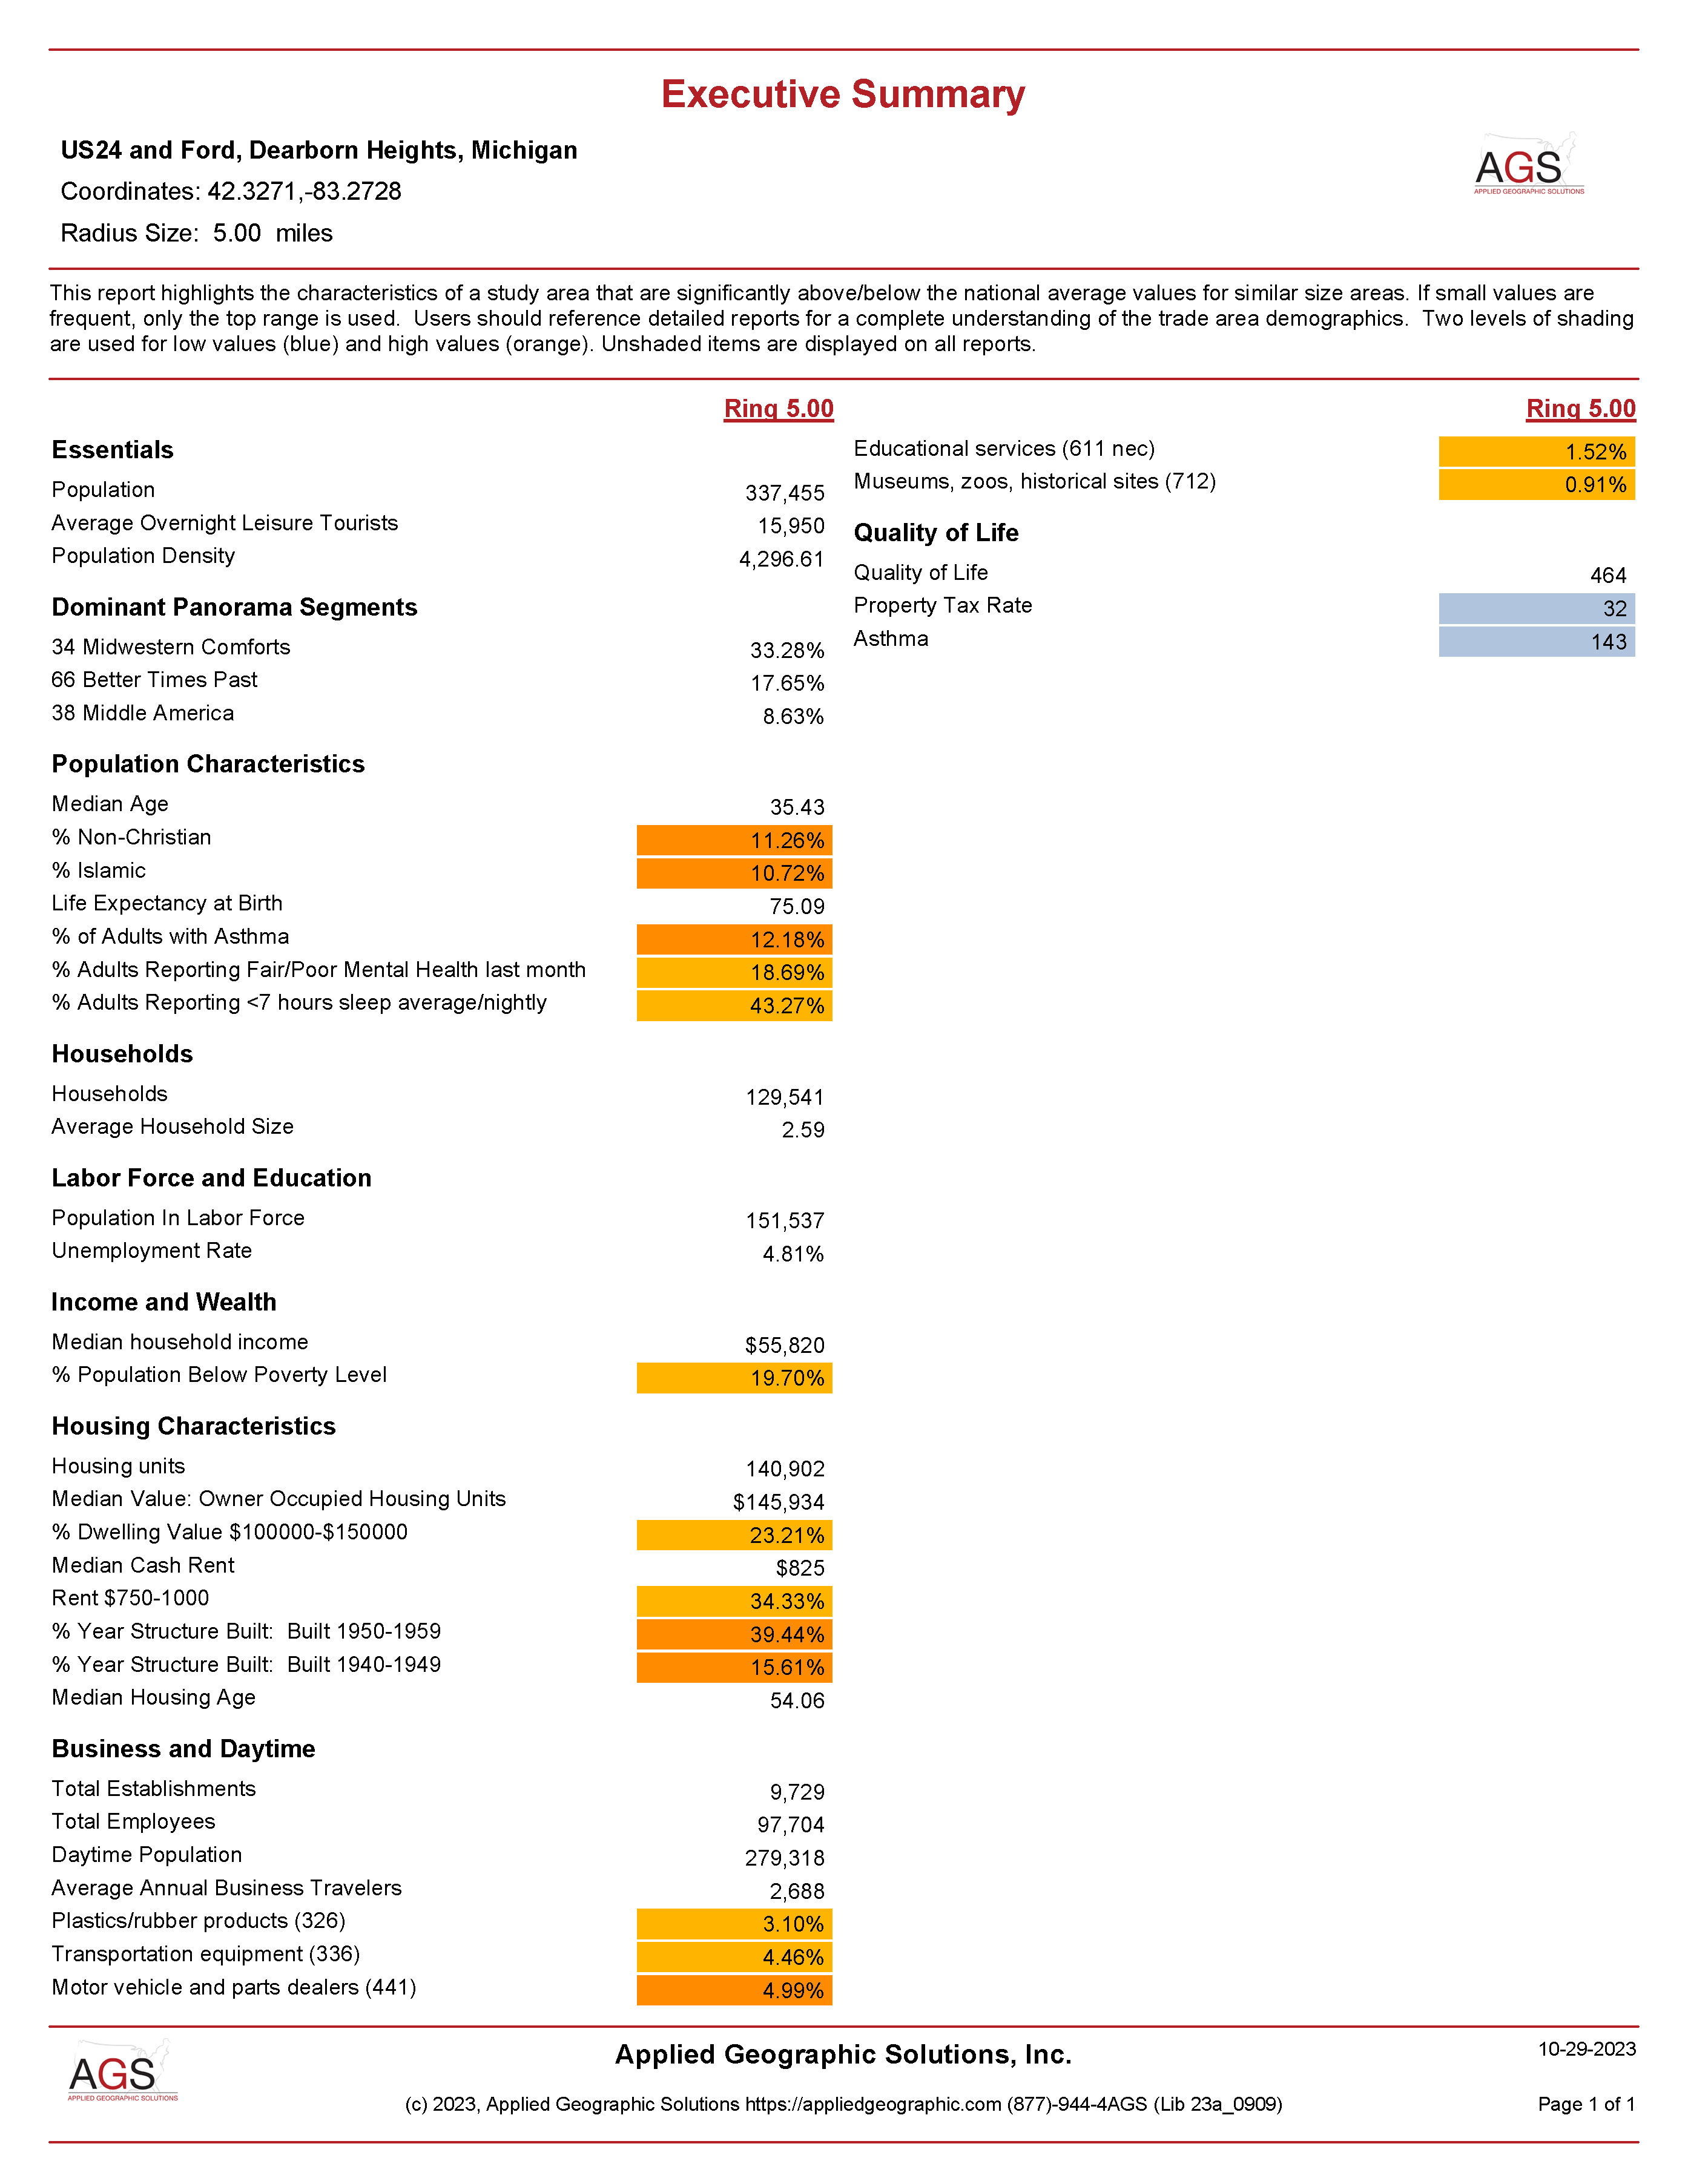
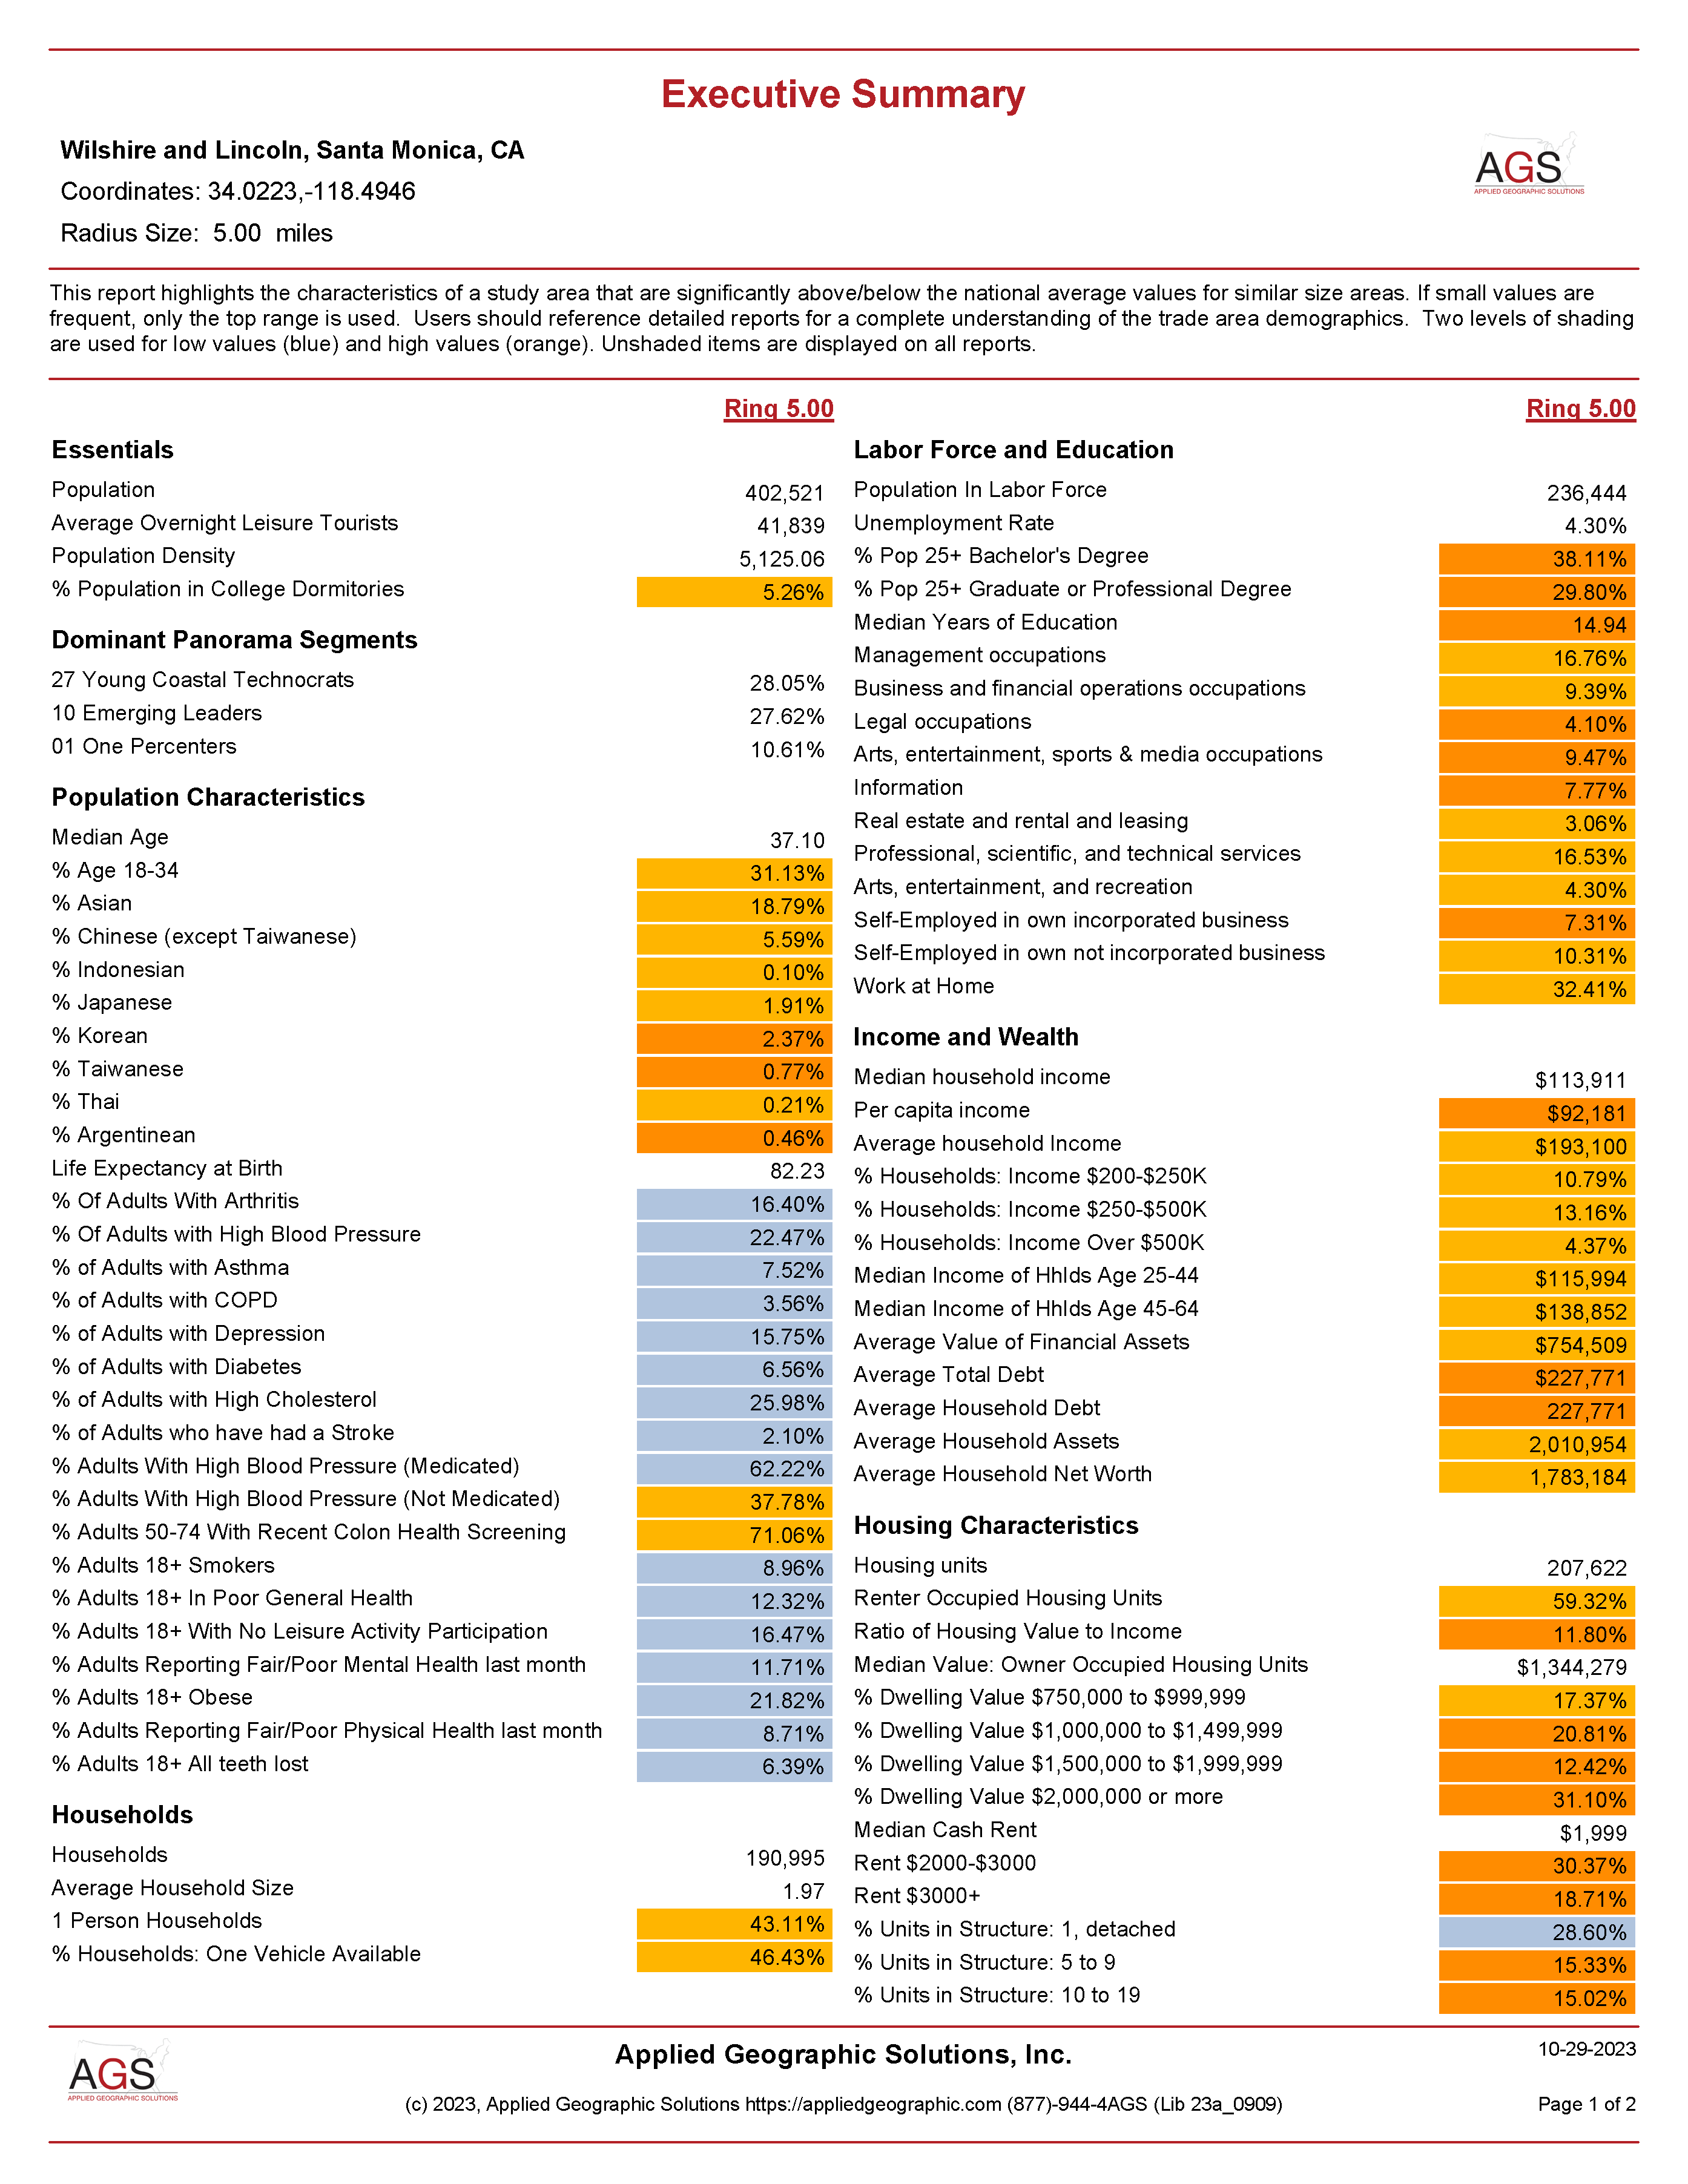
The two reports shown below report key statistics – population, age, income – but report on completely different variables which are locally important. The report for Dearborn Heights, Michigan quickly lets the user know that this area has a significant Muslim population in homes built largely in the post-WWII era with a significant percentage below the poverty level. The same report for Santa Monica, California highlights a young and affluent population in an expensive, emerging tech hub. This report spills over to a second page, given its extreme values.
While we do recommend at least printing out the five page demographic report, the EXS report can be used to separate the wheat from the chaff and streamline the analysis of multiple sites. The report is available on the Snapshot website and API, as well as on the Reblie (www.reblie.com) subscription platform.

Recent Comments