
In recent decades, much of the population growth in Canada has come from immigration. With a national population just shy of forty million, over 25% of the population are first generation immigrants and over 1 million came as refugees.
The nationality of immigrants has changed considerably in recent years, as several waves of refugee immigration have occurred from Syria, Nigeria, and other countries with internal conflict. The table below shows the distribution of the largest immigrant populations, both overall and in recent years:
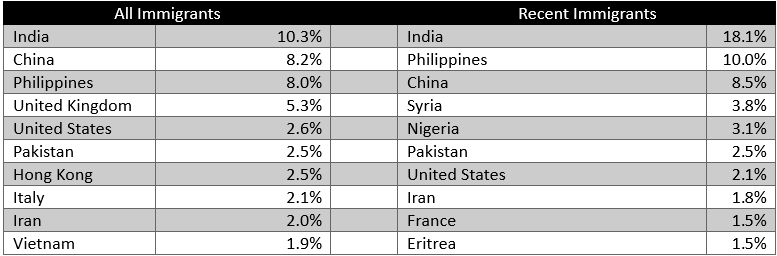
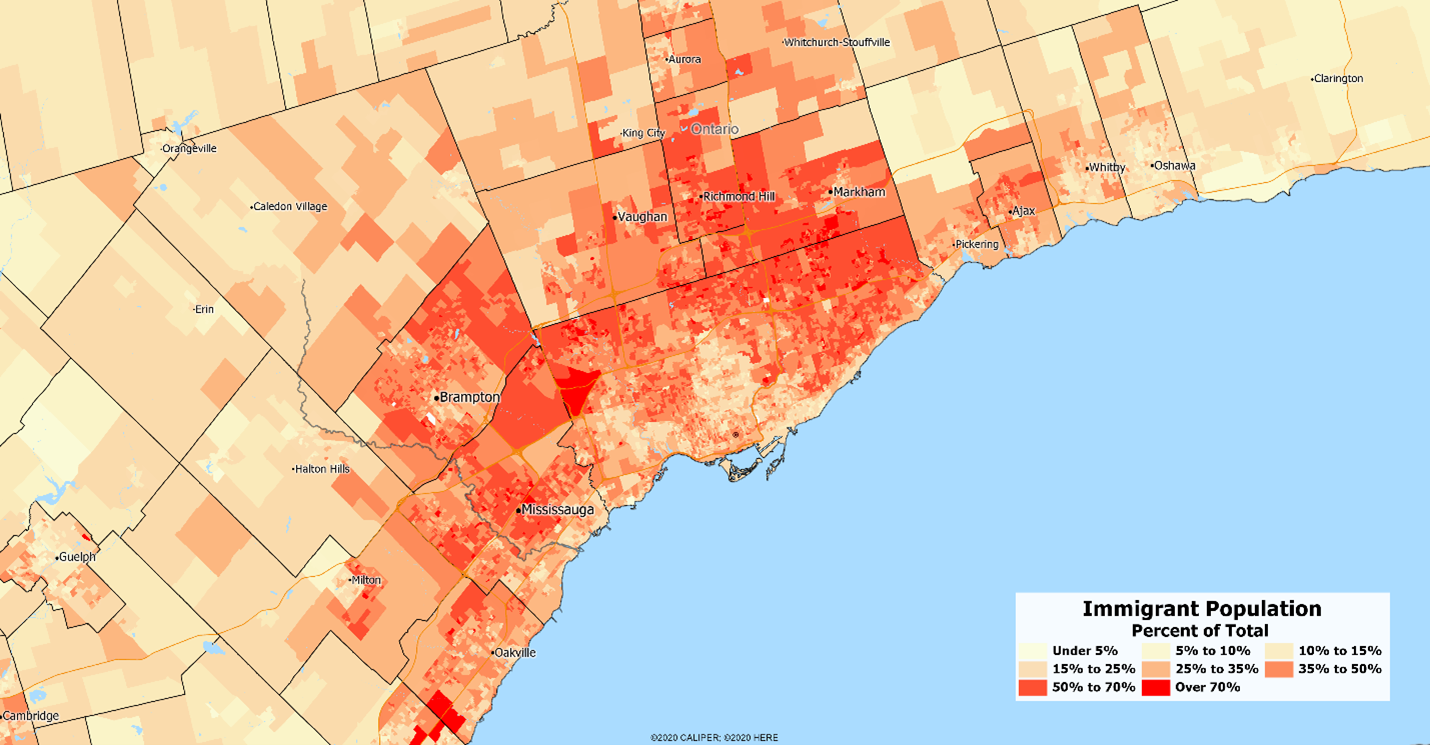
The three largest metropolitan areas – Toronto, Montreal, and Vancouver – together account for 36% of the national population but 60% of the immigrant population. Over four in ten residents of Toronto are immigrants. But even within the Toronto metropolitan area, immigrants have tended to locate north and west of the central city:
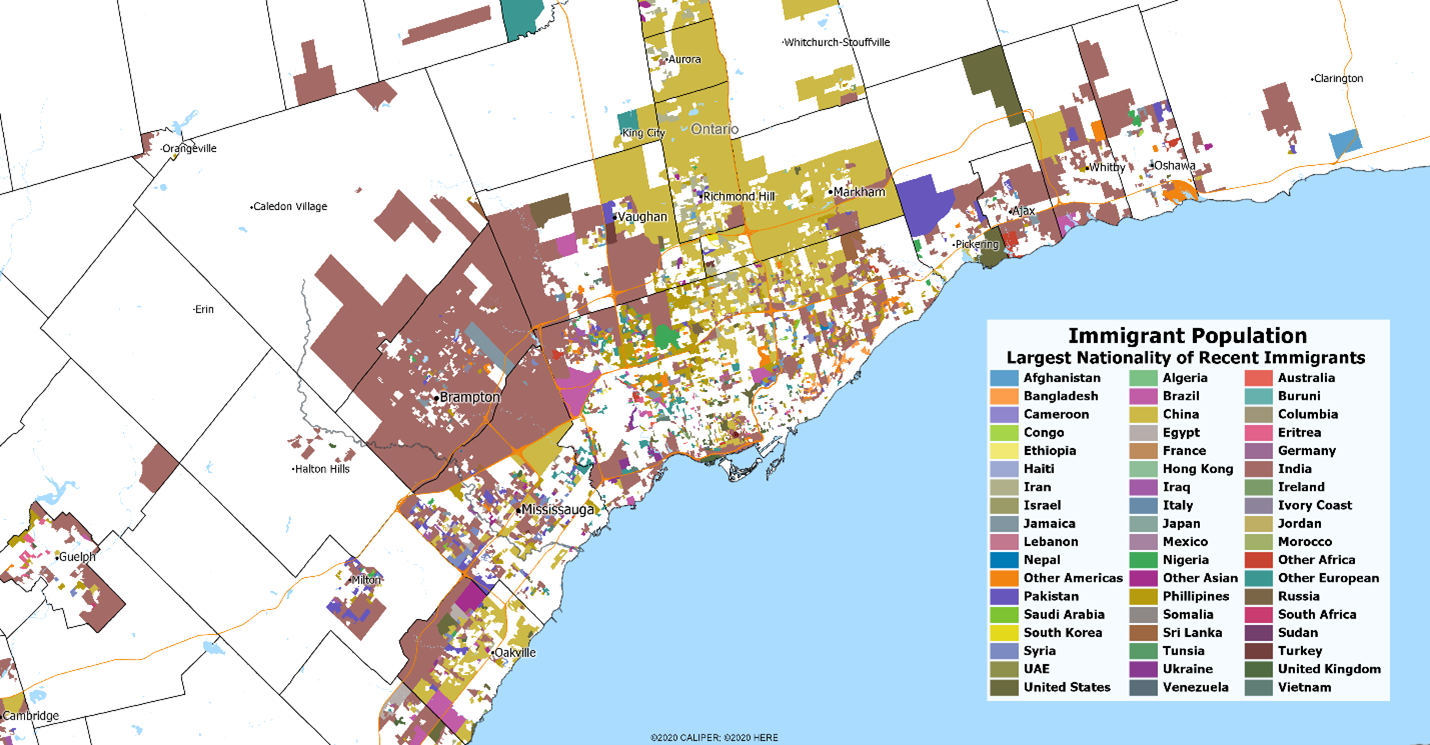
We looked in more detail at the recent immigrant population by country of origin, selecting for each dissemination area with at least 50 immigrants the dominant country of origin. The map below is cluttered and hard to interpret – but that is the purpose of showing it. In Brampton, the dominant immigrant group is from India, while in Markham it is from China. Beyond the two large clusters of immigrant groups, the pattern is more like that jigsaw puzzle that you gave up on trying to finish because it was just too hard. There are local concentrations of every major ethnic group somewhere in the metropolitan area, even if some are as small as a single dissemination area:
We found similar complexities in other major centers. Immigrants to Montreal are largely from Haiti, the former French colonies of Africa, and France itself. In Vancouver, which is often assumed to be largely immigrants from China and Hong Kong, we find areas where the dominant immigrant groups are from Iran or the Philippines.
The Canadian view of the ‘cultural mosaic’ does appear to prevail over the American ‘melting pot’, at least as far as recent immigration trends would suggest.

Recent Comments