Diversity is largely seen as something positive: get people together from different backgrounds and viewpoints to better understand the world around you as it is seen by people who are different than you. But what does ‘diverse’ actually mean? And how can we track progress towards diversity? And how does diversity impact an area’s household income?
The Merriam-Webster dictionary defines diversity as the condition of having or being composed of differing elements. The entry for ‘diverse’ uses the specific example of ‘a diverse population’ defined as composed of distinct or unlike elements or qualities.
Note first that ‘diversity’ is characteristic only of a group of objects, not of any one object. Being geographers, we naturally prefer groups which are spatially defined and will stick to questions like ‘how diverse is this ZIP code?’. On the surface, it seems to be something relatively easy to measure, and our formula engine includes a DIVERSITY() function which is based on the frequently used Simpson Diversity Index (DI). It is a nicely bounded measure (0 to 1) which in effect says – select a random individual from an area, then select a second from the remaining population, what are the odds that they are from a different group?
But what constitutes a group? Race and ethnicity are complex, since someone who is of Hispanic origin can be of more than one race and many individuals identify as being multi-racial or simply check the ‘other’ box. The key is that in order to be a useful measure, the groups must be mutually exclusive.
How are diversity and income related? The measure used here is unidimensional, which means that an area with 80% of its population Black non-Hispanic is considered as non-diverse as if it were 80% White non-Hispanic.
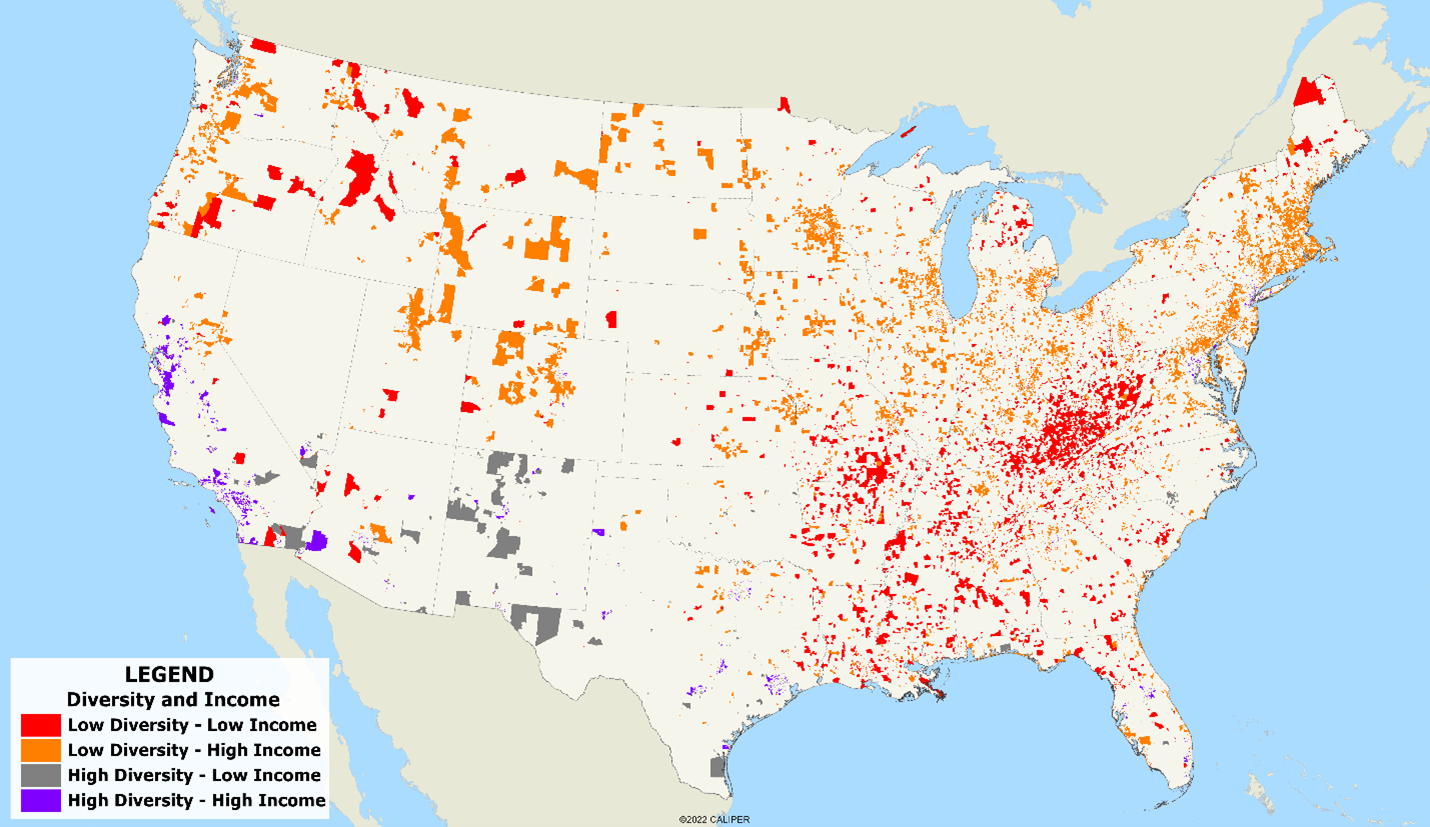
If we classify block groups by diversity and income, the nationwide pattern is particularly interesting. Areas with low diversity and low income are primarily in the rural south (predominantly Black), inner city urban areas (either predominantly Black or Hispanic) or in Appalachia (primarily White). On the other hand, most of the low diversity/high income areas are in the northeast and Midwest states. Large swaths of high diversity/low income areas are found along the south Texas coast and on the Native lands of New Mexico. Most of the high diversity/high income areas are in California, with some minor concentrations in many large urban areas.
Regardless of income, some of the most diverse block groups are not likely what first comes to mind –
- Military bases
- Honolulu, which has three of the twenty most diverse block groups
- Alaska, particularly Anchorage, which has the the most diverse block group in the country
If you want to do more research on the topic of diversity, the Census Bureau has done some work on measurements, and presents a few alternative measures. You can find that article here: https://www.census.gov/newsroom/blogs/random-samplings/2021/08/measuring-racial-ethnic-diversity-2020-census.html.