To further help users understand how the privacy budget has affected small area data, we decided to deep dive into a specific area to see how it looks on the ground. We chose a block group which we know that has not changed over the past ten years, located in a well-established part of Thousand Oaks, California, where our headquarters is. This is not an “outlier”, and it is important to note that we found similar patterns in nearly all block groups nationwide.
The block group 061110059092 (2010) was not redefined, although the unpopulated blocks along the freeway have been merged into block 2000. For convenience, we will label them only using the 2020 numbers, as the block numbering has changed drastically. The ten blocks appear below:

It is largely a residential neighborhood, built in the 1970’s, with open space along the freeway that includes an equestrian center. At a summary level, the block group has changed little over ten years. The number of homes has grown slightly with infill development, and the average household size has decreased slightly over time (as it has generally).

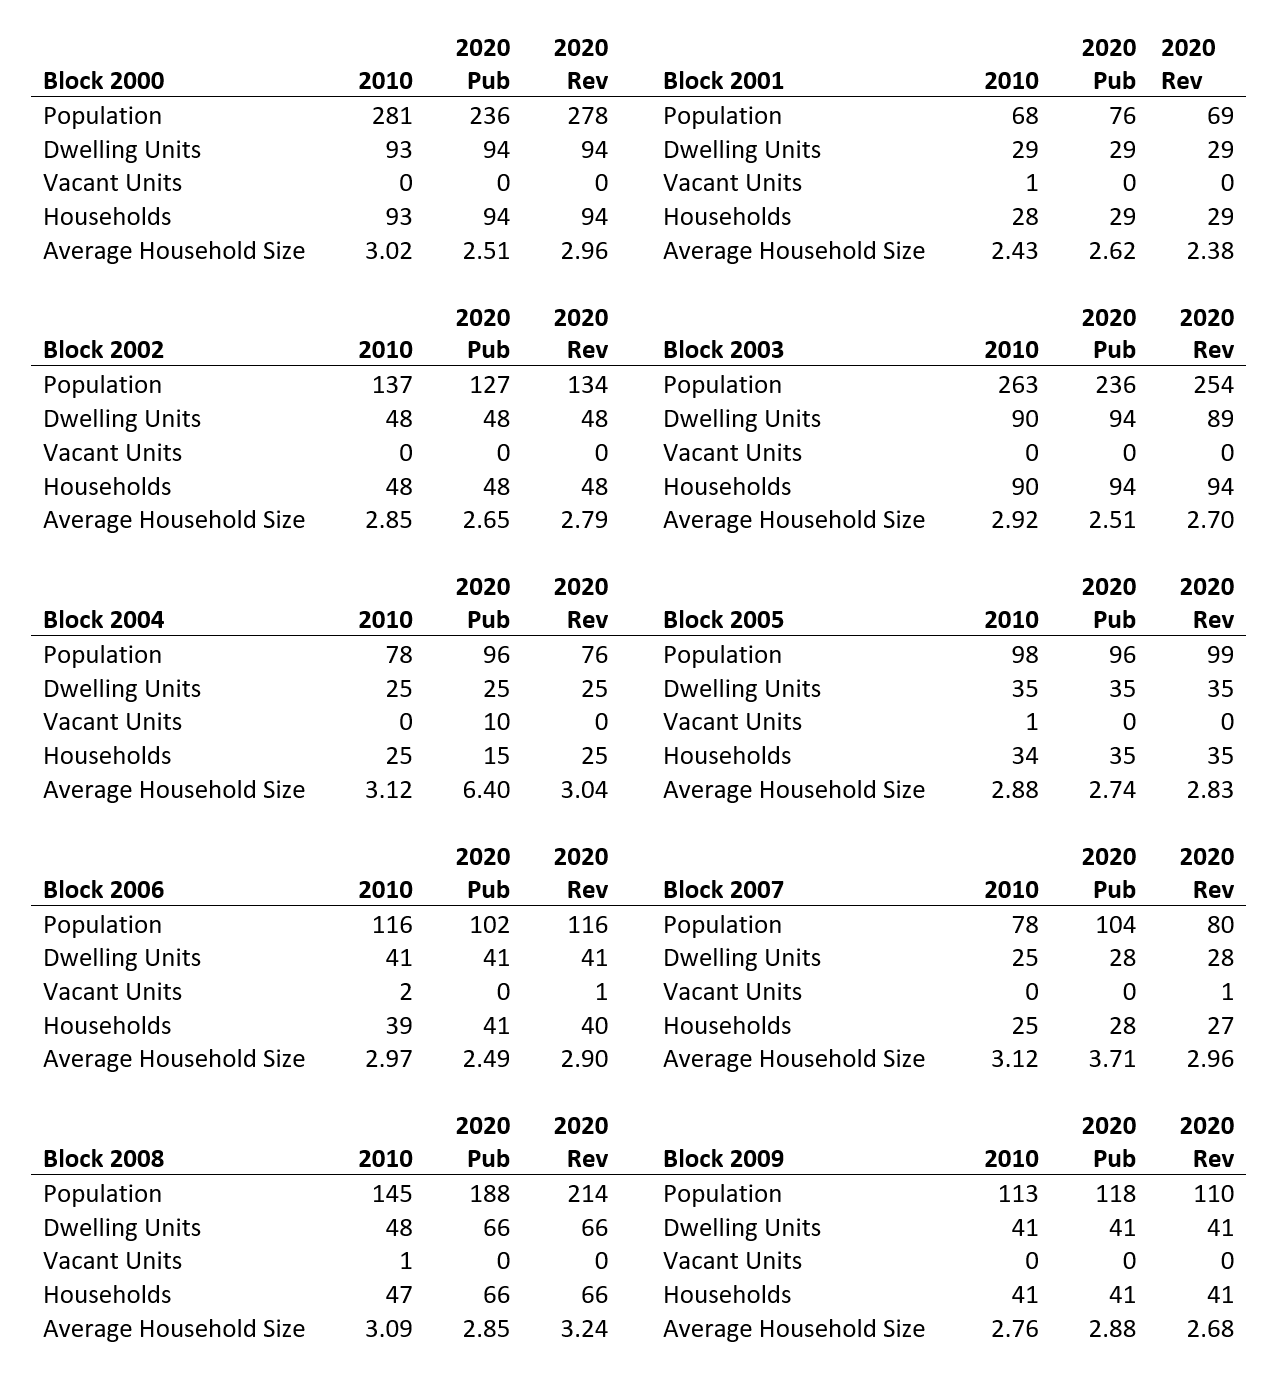
At the block level, the results are much more dramatic. The number of vacant dwellings in the block group doubled from 5 to 10, and yet all 10 are located in a single block (2004) which does not appear to be materially different than the rest. Indeed, we believe that it has vacant dwellings “borrowed” from an adjacent block group!
Further, its population increased significantly, so the average household size jumped from 2.85 (average) to 6.40. The table at the end of the article contains the data for the ten census blocks.
While a household size of 6+ persons does occur in the United States about 5% of the time, this is very abnormal in an established, upper middle-income neighborhood.
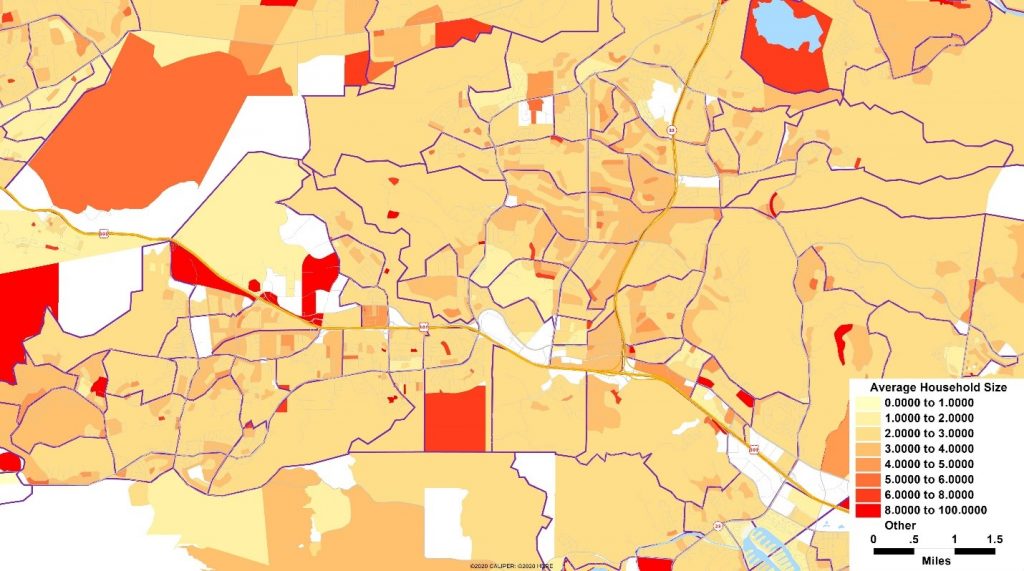
Indeed, if we map block group boundaries and display the average household size, a clear pattern emerges – almost all block groups have a single block which stands out as having a large household size (orange and red on the map below).
On closer examination, we generally find that the percentage of dwelling units vacant is substantially higher than in adjacent blocks in almost all cases.

Since AGS does its demographic modeling at the census block level, this poses particular challenges because only the total dwelling units and population in group quarters are stated to be correct at the block level. Everything else has been manipulated, and even at the block group level, there are significant anomalies.
Our approach to resolving this includes what we refer to as “balancing”, meaning that the entirety of the geographic hierarchy is utilized. State totals (stated by the census as being correct) are used to balance the county numbers, which in turn balance census tracts, block groups, and finally blocks. The outcomes are that the resulting block estimates are well constrained, and do not generally include a single block which looks nothing like its neighbors.
From an internal modeling perspective, this will yield much better results moving forward and avoid using trending on non-comparable datasets. While we can’t know what the actual census results were, we are convinced that the resulting database is likely a more accurate rendition of those results than those which have been published.
If you are interested in learning more about how we cleaned up the census data, please drop us a line. We will be happy to talk in detail about the methodology, results, and provide you with the datasets for comparison purposes.
Block Level Comparisons

