
Some years ago, we released our first iteration of Health Counts, which looked at anticipated demand for health care services at the local level. While this database was a good initial attempt to predict this demand, it wasn’t as good as it could have been. The first issue we found was that our model was too complicated for many people to easily use. Classifications were overtly complex and contained a lot more Latin than it probably should have. This time around, we adopted a procedural orientation – for example, it focuses more on what was done to the patient than why it was done. So instead of worrying about whether a condition was treated surgically or non-surgically, we decided to instead use a much simpler and less jargon-filled approach:
- Where did you go?
- Why did you come here? (primary condition)
- What else is wrong with you or should we know about? (all conditions/observations)
The result is a much simpler and, we think, more usable database that fits very well with our “chronic disease and risk factors” database, consisting of four major groupings:
- Current or projected year
- Type of encounter (ambulatory, emergency room, hospital discharge)
- Primary condition or all conditions
- Major condition categorization (e.g. infectious diseases, neurological conditions, trauma)
The details on conditions remain, but with far less Latin involved. If you are interested in circulatory system conditions, the category will suffice, but if you are interested in cardiac arrest, that detail is there and much easier to find in the new classification.
The other major improvement to our database come in the form of the addition of ambulatory care. The inclusion of these visits is essential, since most medical treatment tends to fall on the mundane side – a vaccination, a wellness exam, or a repeat visit to make sure the blood pressure medication is working as planned. Add to this ER visits and hospital discharges, and we have a much clearer and easily extracted picture of the likely demand for medical services of any kind and for any specialty.
The databases are built by using publicly available record level responses of the relevant health utilization surveys undertaken by the CDC and applied at the census block level using patient demographics. In native form, the data is presented as the expected number of encounters of a specific condition within a given timeframe (e.g. 0.33 for a block for a year). While this may seem unusual for those used to dealing with demographic estimates, many conditions are relatively rare and have expected values of less than one for most small areas, so the data is best viewed as the probable number of encounters.
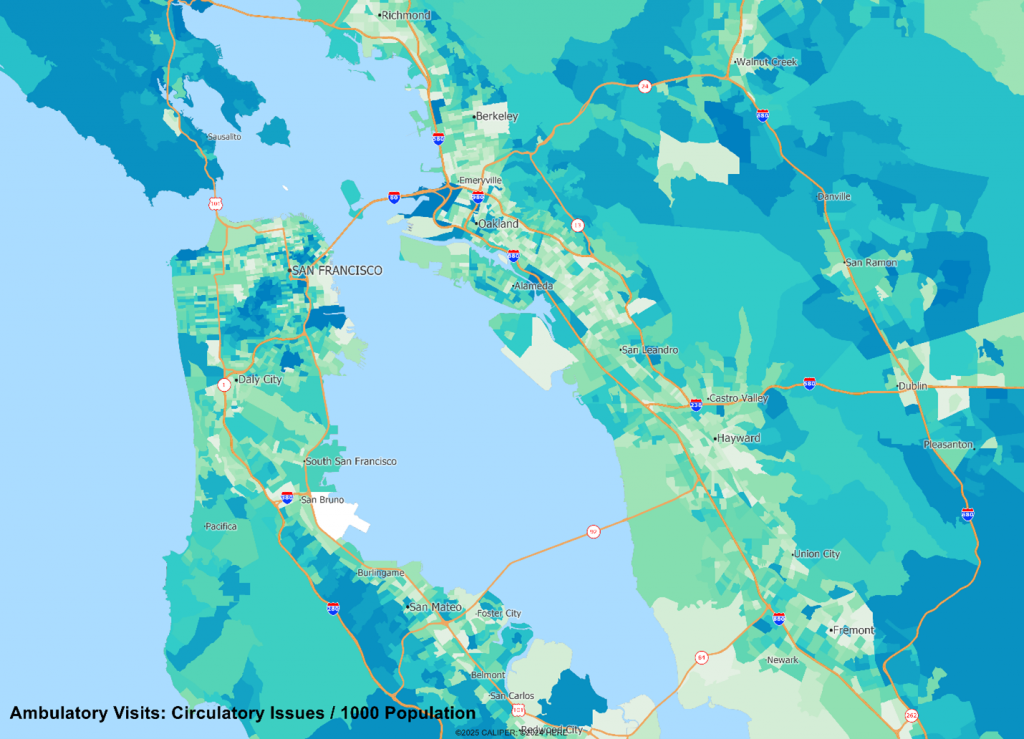
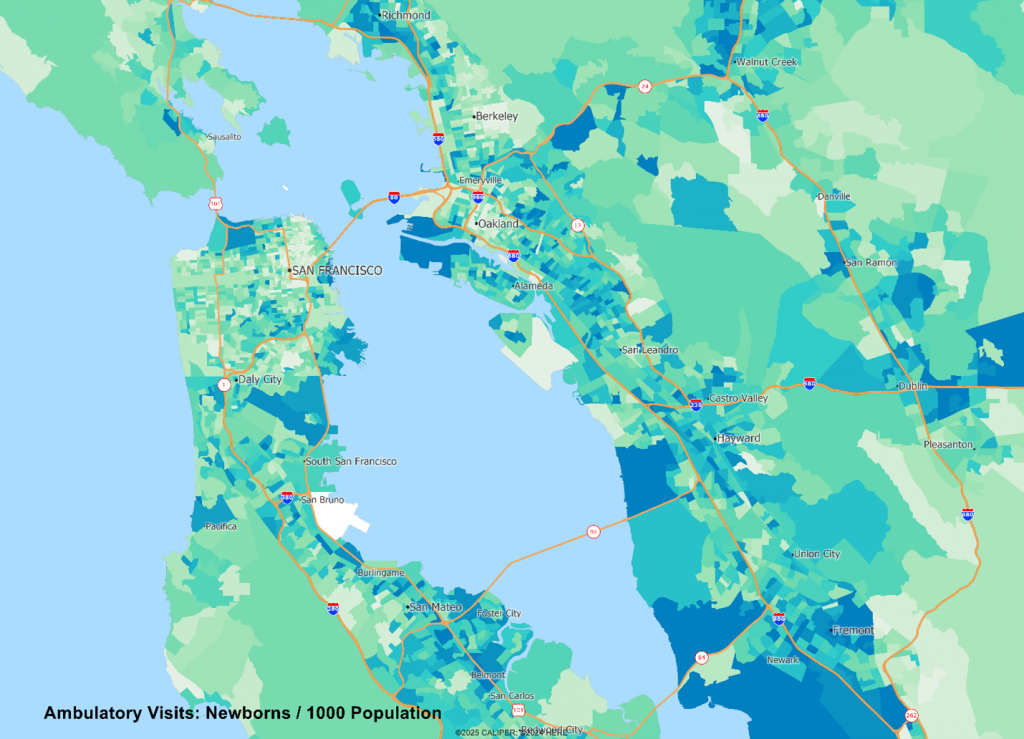
Given that many conditions have very age and sex specific incidence rates, we should not be at all surprised to see radical differences in the spatial patterns of incidence, as we see below comparing cardiac arrest versus newborn visits:
The data are useful in helping to answer two core questions – where should we locate? And what mix of staffing do we need?
But we admit there remains the occasional splash of Latin in there. Just enough to make it sound professional.

Recent Comments