
In recent years, diversity has become one of our cultural buzzwords. Yes, the United States is more ethnically diverse, but does this translate to more diverse neighborhoods in our major cities? To find out, we used both our diversity measure and a categorical measure that looks at the largest group present and its relative concentration.
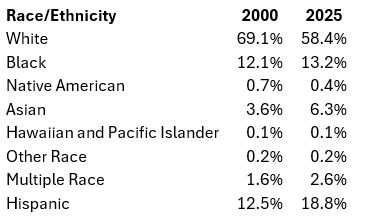
The racial and ethnic makeup of the United States has been changing dramatically over the past couple of decades, led primarily by increases in the Hispanic and Asian population. At the national level since the start of the millennium, the Asian population has nearly doubled while the Hispanic population has increased by 50%. The non-Hispanic white population has decreased from 69.1% to 58.4%.
Several diversity measures have been developed over the years, but these often tell only part of the story. For mapping, we decided to concentrate on the three largest minority groups – Hispanic, Black, and Asian – since these populations do tend towards spatial clustering.
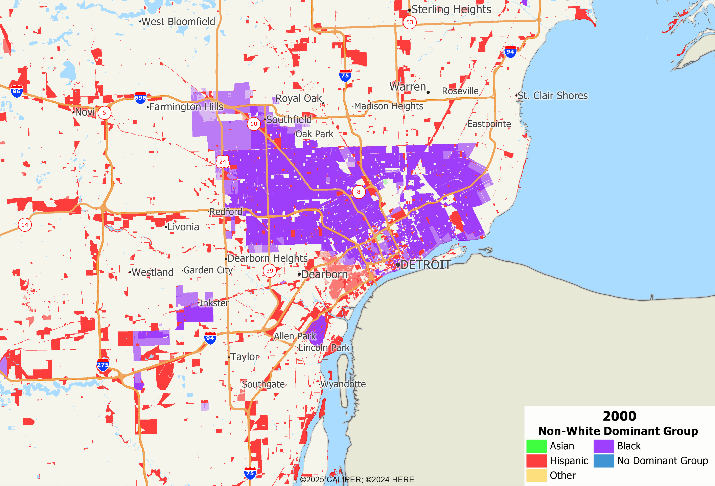
We took a detailed look at five major cities – two historically highly segregated (Detroit, Milwaukee), two thought to be highly desegregated (Las Vegas, Portland) and New York, which is generally viewed as the most cosmopolitan city. We asked the question: are American cities becoming more locally diverse? We mapped five categories at the census block level:
- White (not displayed)
- Black
- Asian
- Hispanic
- Other (includes mixed and other race)
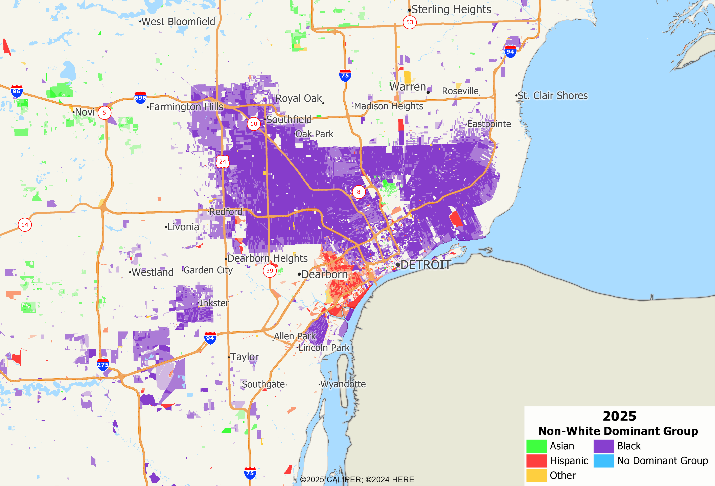
The shading for each group is higher intensity with higher concentration. The general finding is that while areas of minority population dominance have generally expanded, the degree of that dominance has weakened over time. In other words, local neighborhoods are becoming more diverse over time.
Detroit, MI
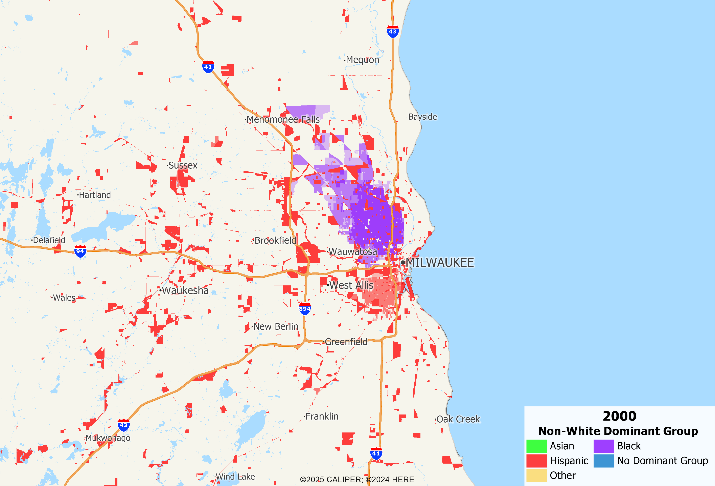
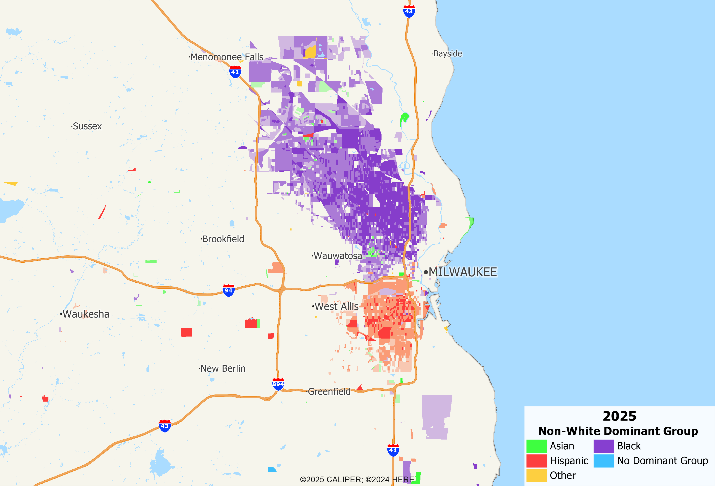
Milwaukee, WI
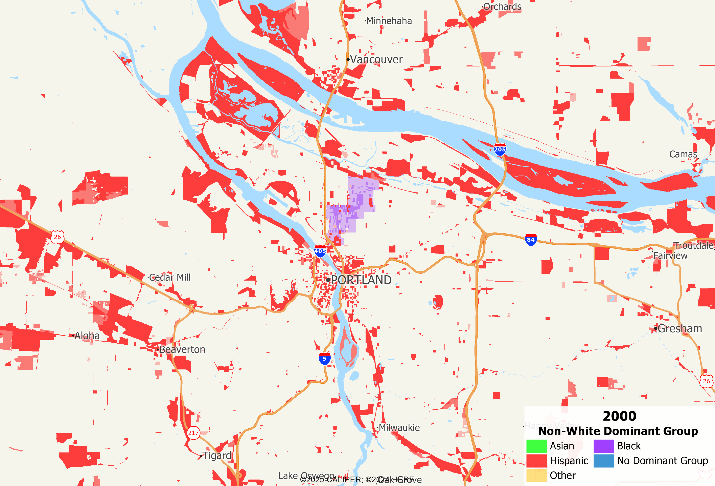
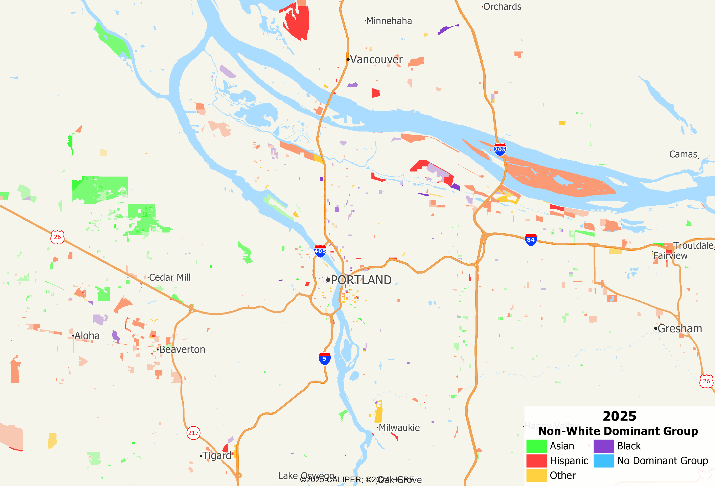
Portland, OR
Interestingly, the predominantly Black area north of the downtown has largely disappeared, and as the city has grown, the concentrations of the Hispanic population in rural areas has also largely disappeared. What appears to be taking place is the new concentrations of Asian population in some of the western and northwestern suburbs.
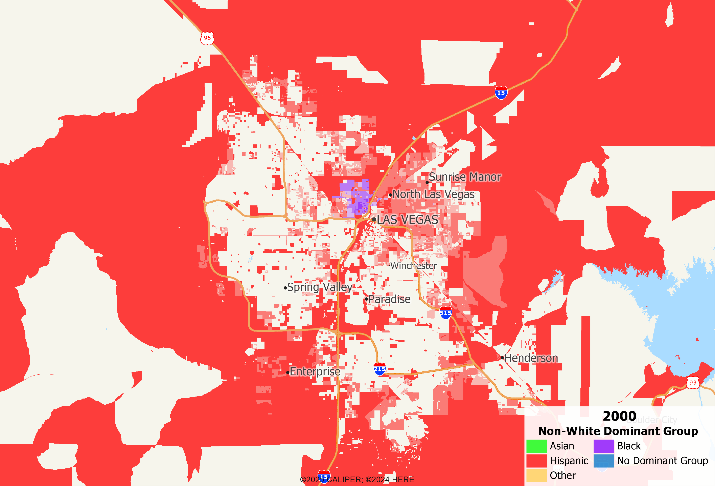
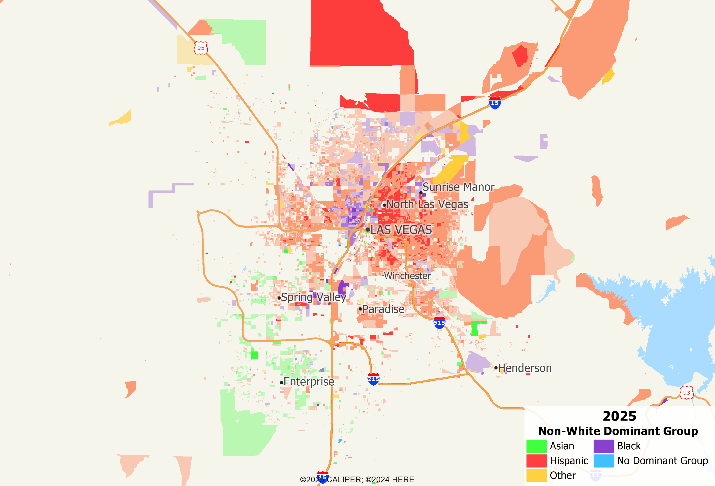
Las Vegas, NV
The city has grown substantially in population over the last twenty-five years. The rural areas outside the city were largely Hispanic and there was one area of the city with a largely segregated Black population. Now, however, the city is increasingly racially divided, with definitive areas with large concentration of Hispanic, Asian, and Black populations.
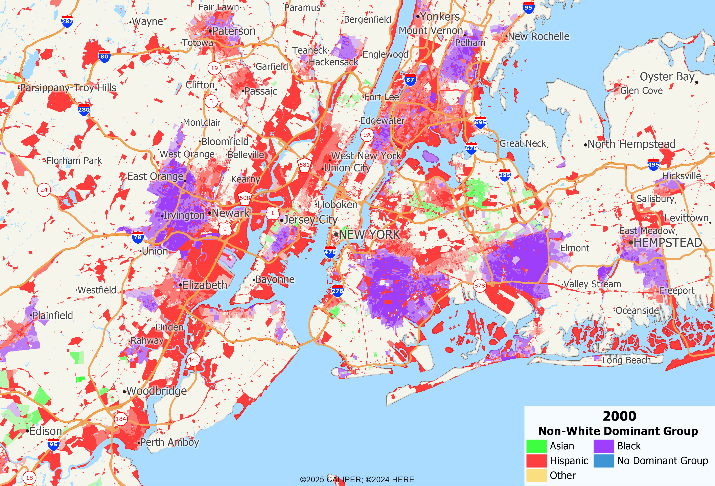
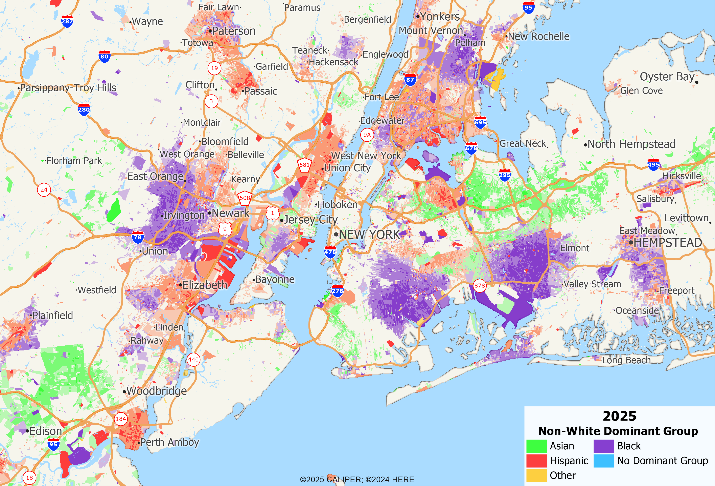
New York, NY
Long held to be the most ‘cosmopolitan’ city in the United States, the New York area turns out to be highly segregated and has been for many years, although the strength of those concentrations does appear to be diminishing over time, especially the Hispanic concentrations.
As the population has grown more diverse, the local expression of that diversity has not kept pace in general. Using our standard diversity measure (a variant of Simpson’s measure), we find two findings –
- The smaller the geographic area, the less diverse its population
- The smaller the geographic area, the greater the trend towards diversity
The county level is an anomaly in the table below that arises because of the massive population size differences in counties. When we look at the average diversity score by level of geography, we can see that the measure has increased more locally than nationally:
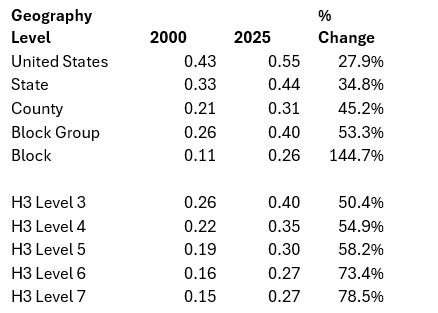
Interestingly enough, the smaller the area in question, the more likely that it has a more diverse population than twenty-five years ago, despite the ongoing ethnic concentrations within cities: your average census block is now more diverse than your average block group was then. While racial segregation remains a significant issue in American cities, we are encouraged that it is diminishing over time.

Recent Comments