
Since the 1970s, the average age of Americans has been on a steady rise, creeping toward 40 years old. As we age, more and more people will need different living situations from the typical single-family home, either in an active senior or assisted living facility. This poses an interesting investment opportunity for developers looking to create housing for our aging population, but understanding the demographics will help make a wise investment.
One key piece of the puzzle is understanding where seniors actually live—and not just in traditional households. A significant portion of the aging population resides in “group quarters,” a U.S. Census term for communal living settings like assisted living facilities, nursing homes, college dorms or even correctional facilities. Until now, detailed breakdowns of these group quarters populations—by age, sex, or race—haven’t been available from most data providers. That’s changing.
Many group quarters populations are highly age-specific. College dorms and military barracks typically skew young, while nursing homes and assisted living facilities represent the opposite end of the spectrum. If you don’t model these groups separately from household populations, you risk distorting the age distributions of neighborhoods—particularly in areas near universities or senior communities.
At AGS, we’ve modeled these distinctions at the block level for over a decade. But in our upcoming 2025A release, we’re making that data available to our clients for the first time. Our 2025A dataset includes a suite of new demographic variables for group quarters populations:
- Group Quarters by Sex (Male/Female)
- Group Quarters by Race/Ethnicity (subset of our full demographic offerings)
- Group Quarters by 5-Year Age Cohorts
This level of detail allows us to isolate specific populations—like individuals aged 65 and older living in group quarters. While not all of these individuals are in assisted living (some are in correctional facilities), this is still a crucial data point for anyone analyzing the senior housing market.
Nationally, about 1.8 million people aged 65+ live in group quarters. That’s 22% of the total group quarters population, and this proportion is only expected to grow as the U.S. population continues to age. Today, over 60 million Americans are in the 65+ category, and the demand for assisted living facilities is projected to increase dramatically over the coming decades.
To illustrate this data, we looked at Palm Springs, California—a popular retirement destination. Below are two maps generated from our new 2025A dataset. The first map shows the percentage of the total population age 65+, by census block. The second map shows the percentage of the group quarters population age 65+, also by census block.
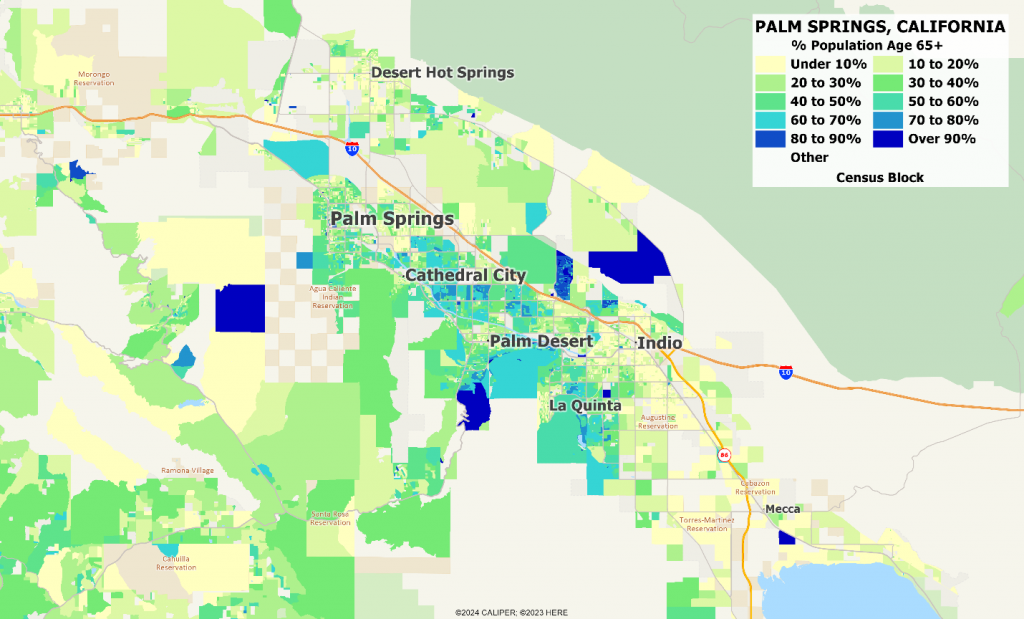
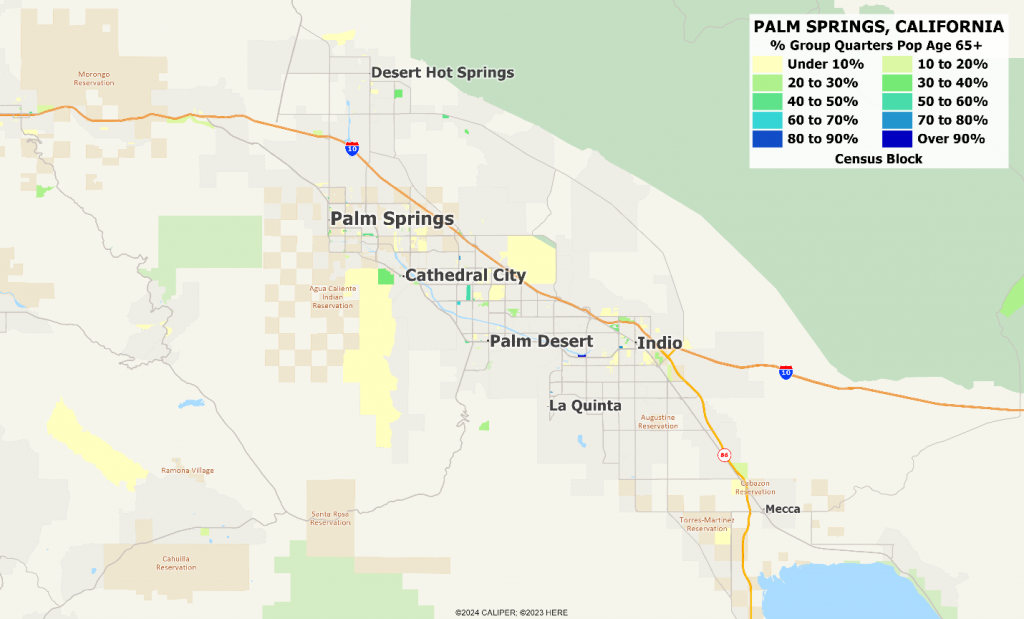
What stands out is the lack of spatial concentration among group quarters facilities. Even in senior-heavy regions like Palm Springs, assisted living and retirement homes are often scattered across neighborhoods rather than clustered together. This reinforces the importance of granular, block-level data when evaluating development opportunities.
For commercial real estate investors and developers, this data offers a new level of precision. Whether you’re siting a new facility, evaluating demand, or understanding neighborhood dynamics, knowing who lives in group quarters—and how that population is aging—can provide a critical edge.

Recent Comments