We get asked often for quotes for CrimeRisk data on the ZIP code or county level, and we always advise against it. To be fair, our issues with using ZIP codes for demographic analysis go deeper than just using that level of geography for CrimeRisk, but with that database, it is a particularly bad idea. Here is our official case for you to never use CrimeRisk data at the ZIP code level (or higher).
First, it is important to start with some context on ZIP codes. ZIP codes in the US, and FSA (forward sortation area) in Canada, have been very popular in the marketing and analytical world for several decades. Why? Because it was easy to obtain the postal information for customers – you could count customers by ZIP code and determine what ZIP codes were getting higher customer rates, infer the demographics of them (albeit loosely), and you could then target future customers based on this information. In the 1980’s and 1990’s, direct mail was king – get your customer’s postal information, and you could build a profile of them using geodemographic segmentation. You could select ZIP codes, carrier routes, and even ZIP+4 using that profile, then track your results.
But why do we continue using them? In both Canada and the United States, FSA and ZIP codes continue to be used by many, despite the clear problems with them. They were designed to efficiently deliver mail, not analyze households and consumer behavior. Boundaries often split neighborhoods, they can be discontiguous (especially in Canada), split counties, and even spill over state and provincial lines. After all, the goal is to get mail to Fred Bloggs, who will otherwise call and voice his dissatisfaction. It is not to optimize direct marketing and certainly not to optimize location analytics. Second, they are wildly different in size and function. Rural areas have often massive ZIP/FSA codes that cover thousands of square miles. Some areas have low population, others are massive. For display purposes, the difference in size makes the interpretation of thematic maps difficult – the eyes are naturally drawn to the larger areas, which are often low population and more likely to have extreme values.
For our purposes, we will consider our CrimeRisk data, which is native at the block level. Many ZIP codes cover a range of neighborhoods with radically different demographics, and different crime profiles. Using a ZIP code level crime index is pretty much nonsensical, and we strongly discourage it!
Here are some examples of maps that clearly demonstrate our points.
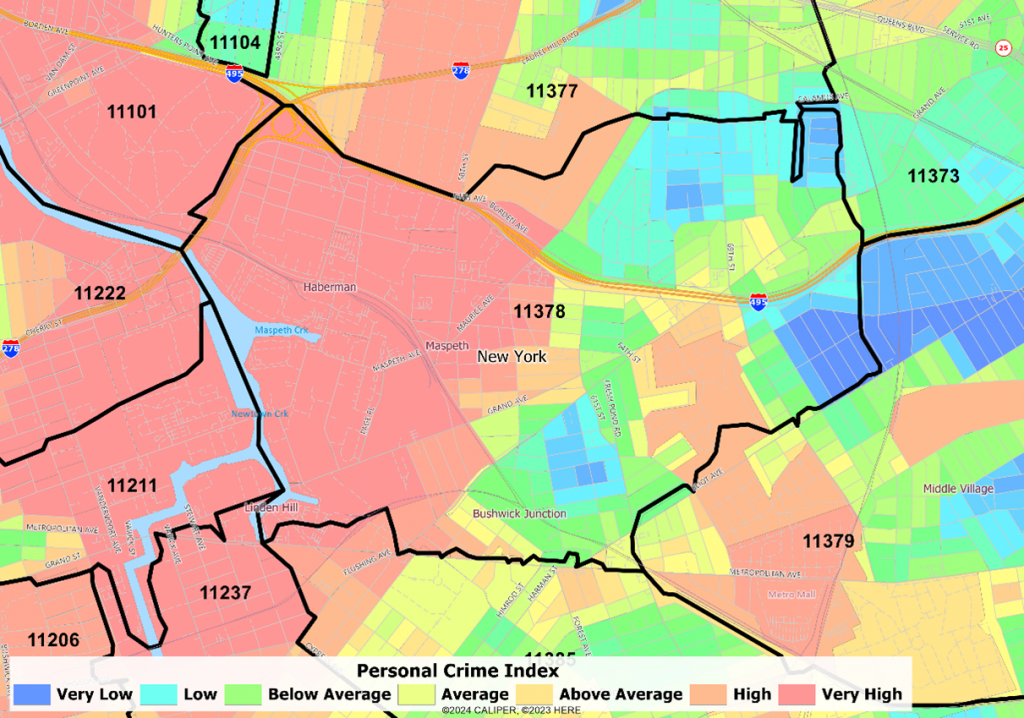
ZIP 11378, Maspeth NY (Queens County)
Within this single zip code, we have a range from very high to very low, over the space of just a couple of miles.
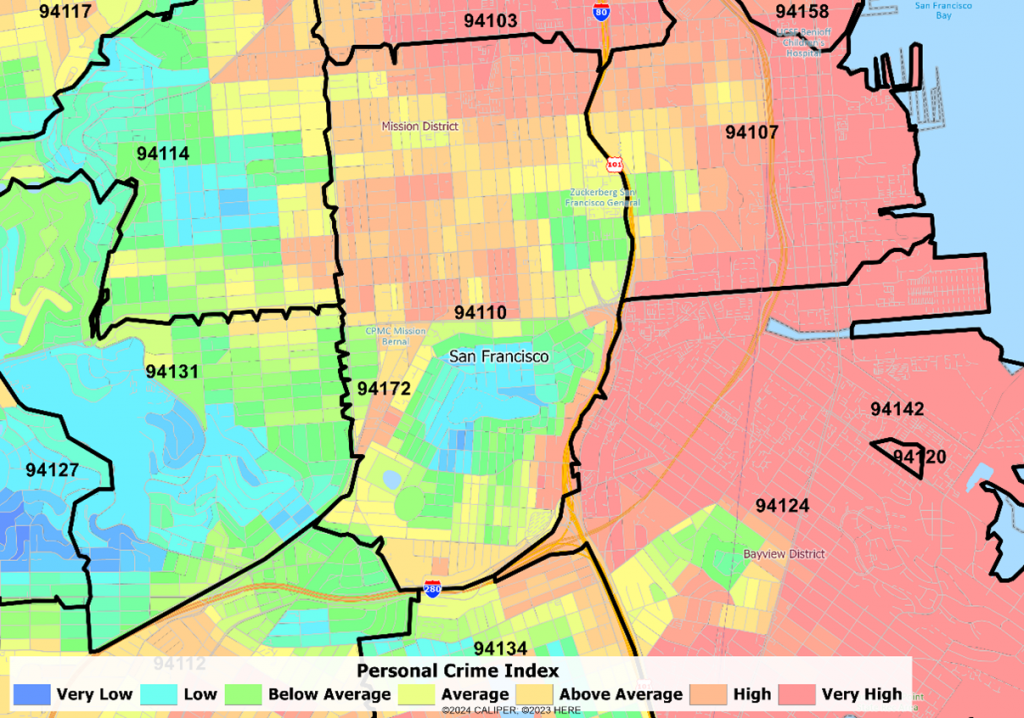
ZIP 94110 San Francisco, CA
This ZIP code covers the Mission District in the north (very high crime) to some very safe residential neighborhoods in the south.
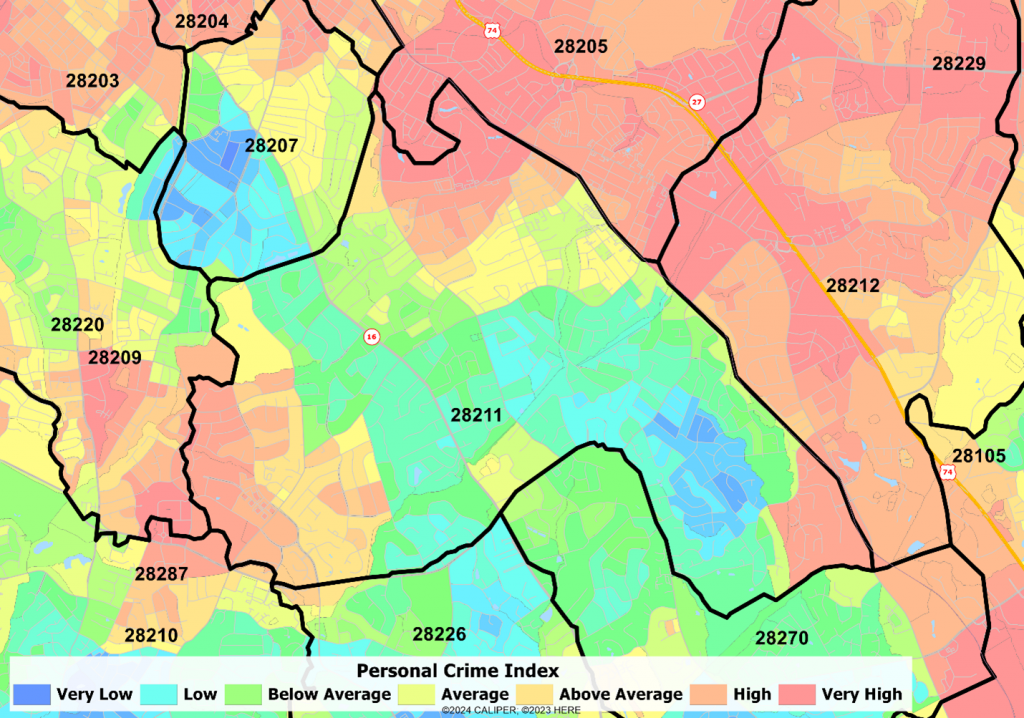
ZIP 28211, Charlotte NC
High crime on two sides, low crime down the middle
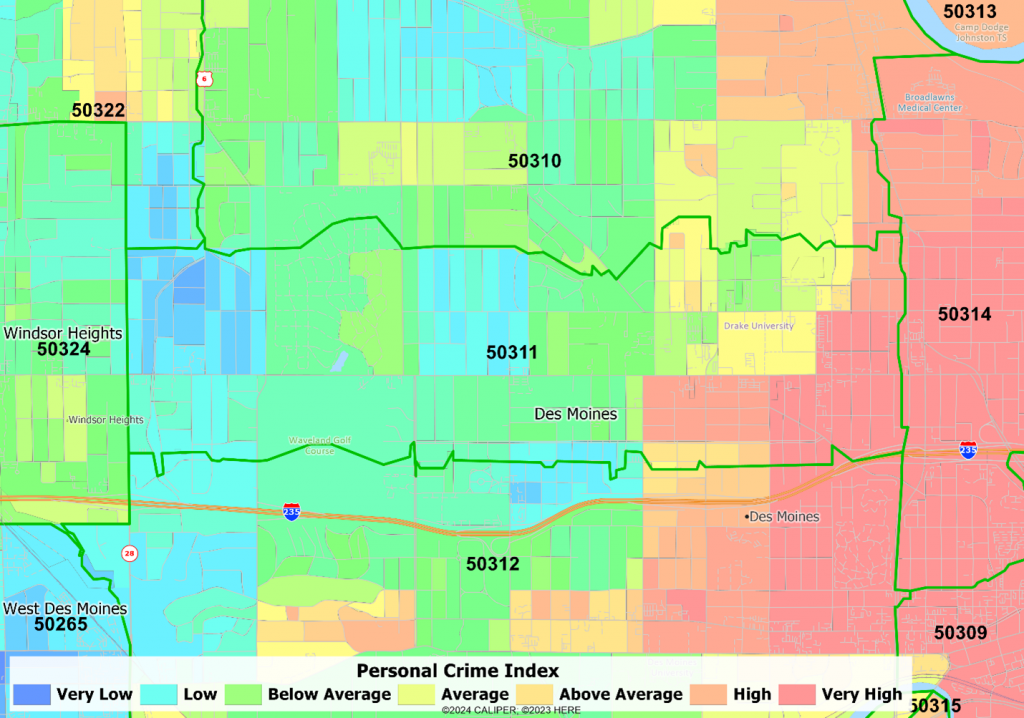
ZIP 50311, Des Moines IA
This is not just a symptom of major cities. Note the proximity of very high and very low crime within just a few blocks. The “average” of the zip code is wildly high in the safe areas, and wildly low in the high crime areas.
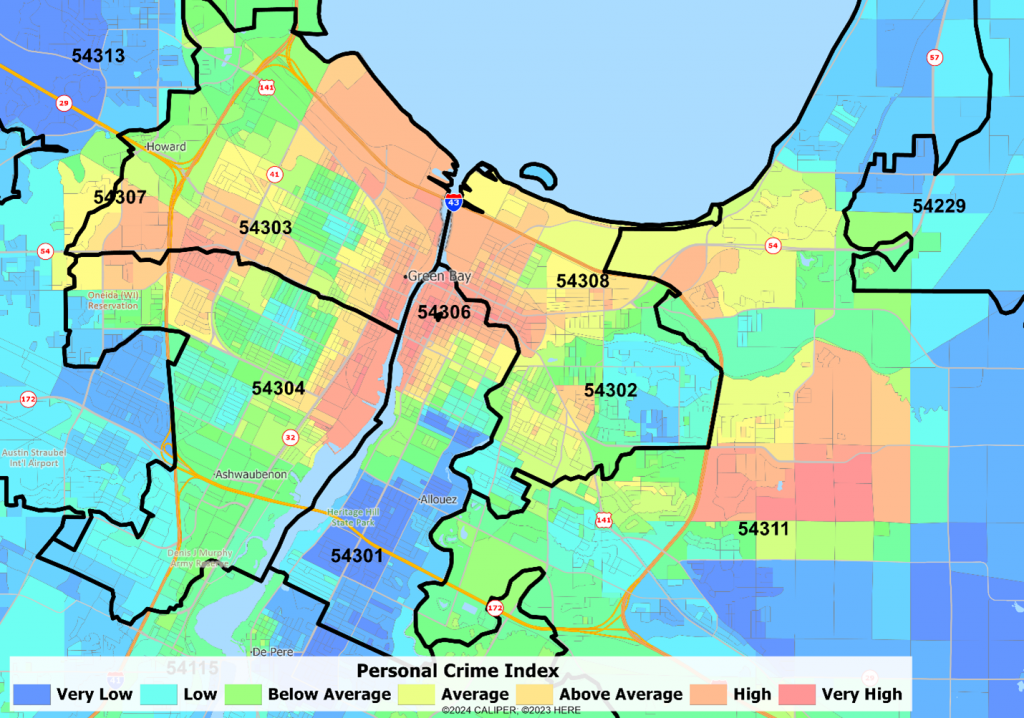
Here are several ZIP codes in Green Bay, WI. Note how the blue (safe) zones and the red (unsafe) pay little attention to the ZIP code boundaries.
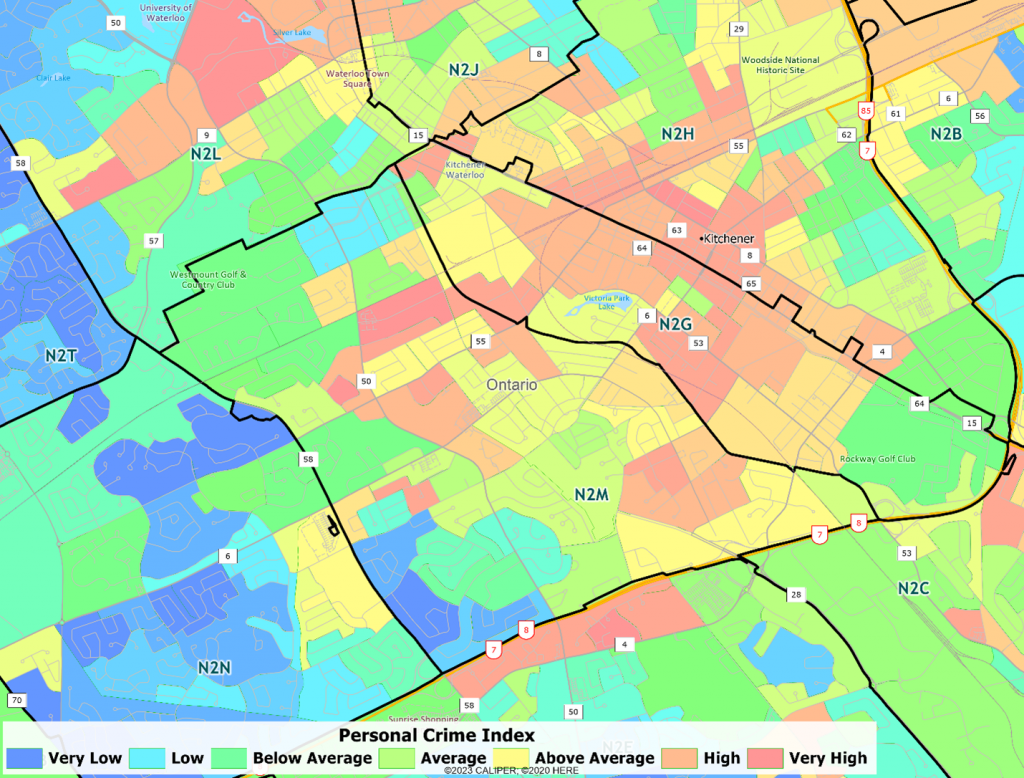
Any better in Canada? Nope. N2M in the mid-size metropolitan area of Kitchener-Waterloo-Cambridge ON shows the same patterns – very safe and very unsafe within the same FSA postal area.
Our recommendation? Use ZIP code or FSA statistics ONLY when you absolutely must, or, where the target of your analysis is at that level of geography, like for bulk direct mail. Best practice will always be to use the most detailed geography you can work with – census block or block group is preferred. But pay attention to the fact that crime can be radically different one side of a major street to the other – and these are almost ALWAYS block group/block boundaries. If possible, get the coordinates of any address and use a small radius around it – ¼ mile in dense areas, ½ mile in suburban, at least 1 mile in rural areas.