Last week we talked about the complexity of the concept of income. We continue here by focusing on the Census Bureau definition, and how that definition introduces spatial biases that could substantially impact your location decisions.
So how does the Census define household income?
“Census money income is defined as income received on a regular basis (exclusive of certain money receipts such as capital gains) before payments for personal income taxes, social security, union dues, Medicare deductions, etc. Therefore, money income does not reflect the fact that some families receive part of their income in the form of noncash benefits, such as food stamps, health benefits, subsidized housing, and goods produced and consumed on the farm. In addition, money income does not reflect the fact that noncash benefits are also received by some nonfarm residents which may take the form of the use of business transportation and facilities, full or partial payments by business for retirement programs, medical and educational expenses, etc.” (https://www.census.gov/topics/income-poverty/income/about.html)
Aside from the fact that the word income is used as an integral part of the definition of what constitutes ‘household income’, this is quite instructive even if it is a little long winded. It is a narrow definition of income which excludes some significant monetary receipts and most non-monetary ones. Note that the census bureau lists a stunning 15 different ways to define income (https://www.census.gov/topics/income-poverty/income/about/glossary/alternative-measures.html), many of them minor variants on a theme.
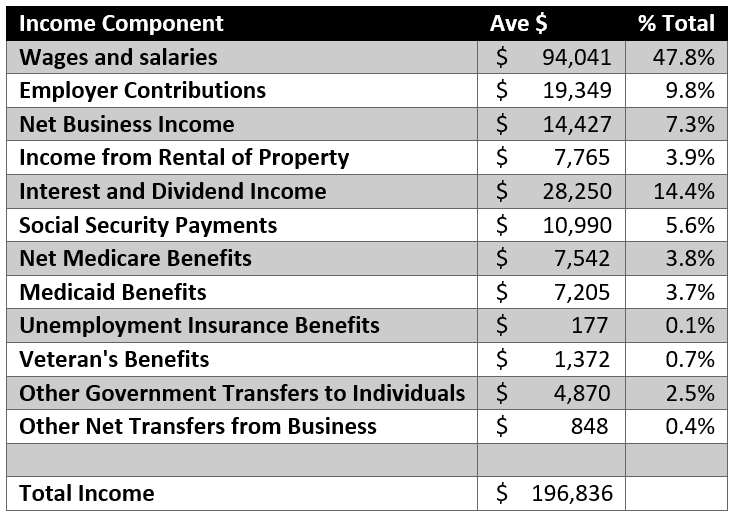
The BEA (Bureau of Economic Analysis) estimates average household income at $214,584, substantially above the current census based AGS estimate of $118,679. BEA income is broken down as:

This has some significant ramifications:
- Actual income, including non-cash items, is significantly greater than that estimated by the census bureau. Note that many of the monetary differences (capital gains) are important for high income households, but many of the non-monetary differences (food stamps, subsidies) affect mainly lower income households.
- As a percentage of income, these exclusions are high for low income households and high for high income households. The percentage of actual income captured by the census bureau is highest for middle income households. The actual income distributions are likely more positively skewed than reported, but importantly, the lower end of the curve is substantially understated. The estimates of census poverty levels specifically exclude many of the larger programs intended to alleviate the problem (https://appliedgeographic.com/2023/09/rethinking-poverty-and-income-inequality)
- Most government transfer payments – business and individual Social Security and Medicare taxes – are not deducted from census income, while payments from such programs are. While net transfers average $17,750 per household, the net transfer masks the fact that most under age 65 receive no benefits, and most payments into the program are from those same workers. The spatial impacts of such payments vary substantially depending on the age distribution of any geographic area – areas with younger residents receive lower transfer payments but have significant deductions that average about $14,500 per household that are not subtracted from income.
Using household income as a key determinant in any location model introduces biases of unknown magnitude. Are there better measures available? We will discuss this in the coming weeks.
