When we put together a new release, one of my favorite things to do is look through the list of new variables and pick out the odd, the unique, the interesting, and think about the use cases of who needs them. Just like I do, the staff also went through the list, we picked our favorites, and mapped them for you. So, what did we choose?
Matt, Senior Vice President and Chief Demographer
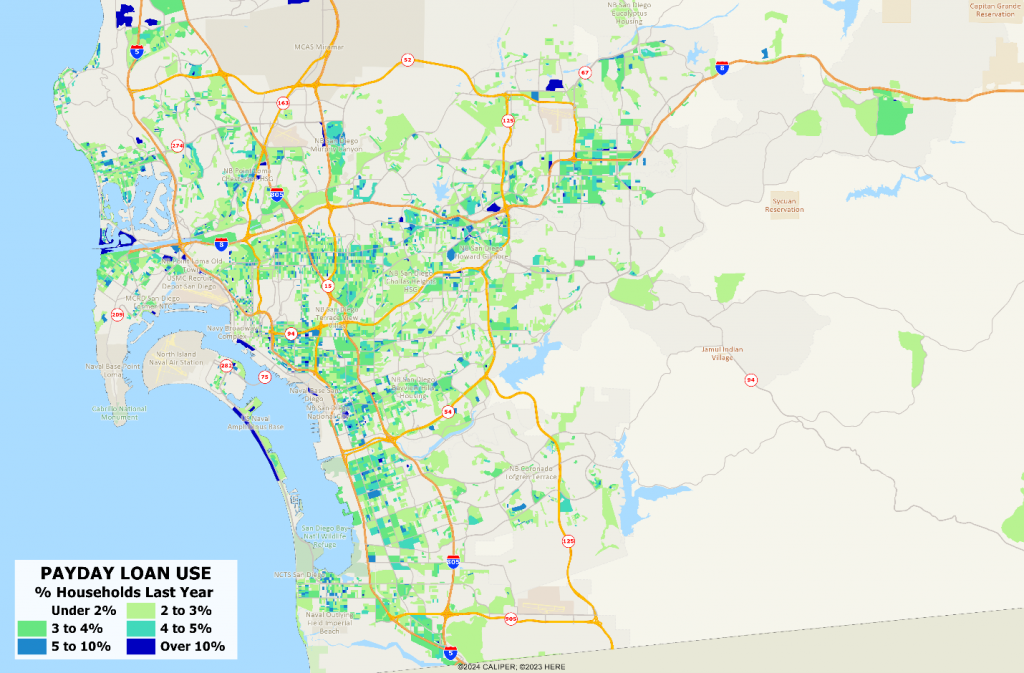
From the newly revamped Assets and Debts database, Matt chose the percentage of households who used payday loans this year. We mapped this variable at a census block level over the San Diego area, since there is a high percentage of military families in San Diego, and sadly, many military families utilize payday loans.
Oscar, Director of Customer Success
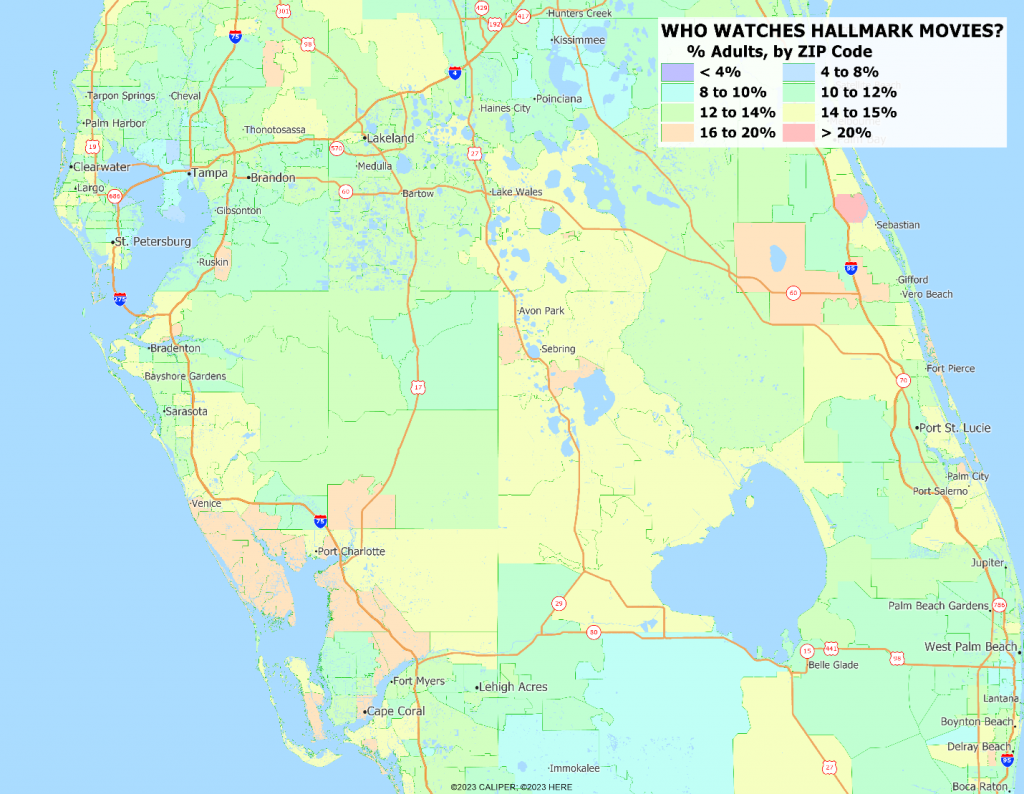
If you tuned into a staff meeting on Tuesday morning, you might hear us all making fun of Mike (all in good fun, of course). Last Christmas, Mike made the grave mistake of admitting to us that he likes Hallmark Christmas movies. So, when the list came out, Oscar couldn’t resist asking for Hallmark movie watching to be mapped over central Florida by ZIP code. This one is for you, Mike. Feliz Navidad.
Ben, System Analyst
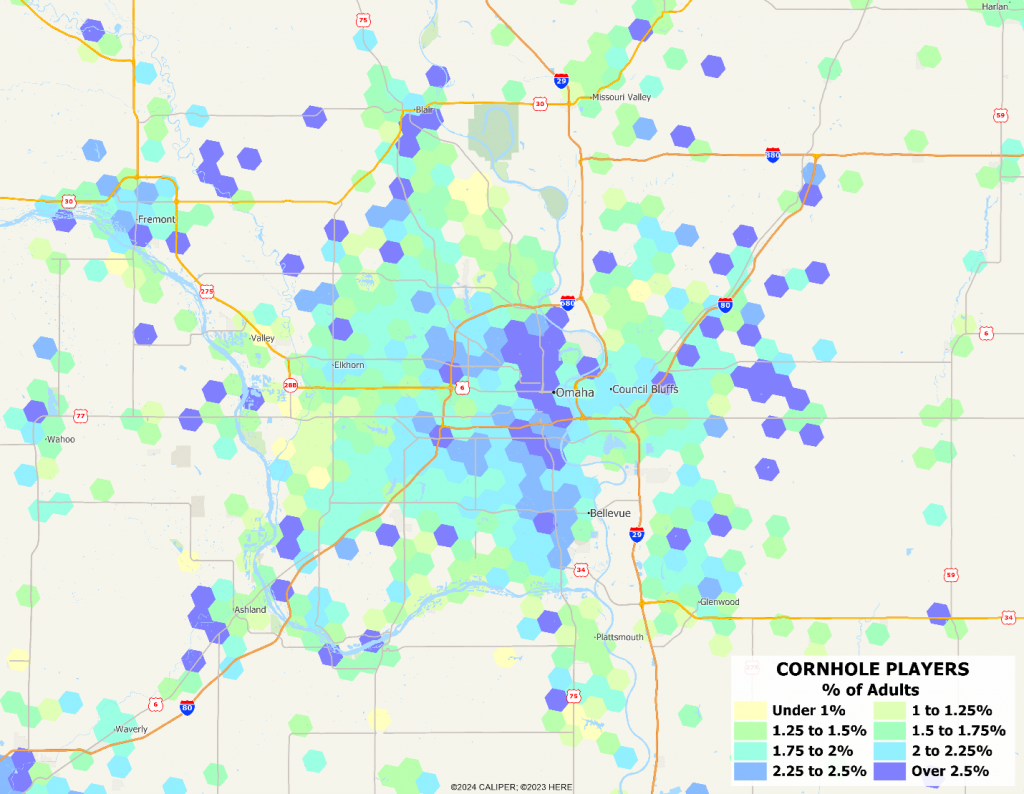
Ben, a true 20-something, saw the new list and spotted some new sports variables on the MRI list. If you have ever been to a backyard BBQ, a college football tailgate, or a day at the beach, you may have played cornhole. So do a lot of people in Omaha, NE and Council Bluffs, IA. We mapped the new variable using the H3 hexagons on level 7.
Elyse, Director of Marketing
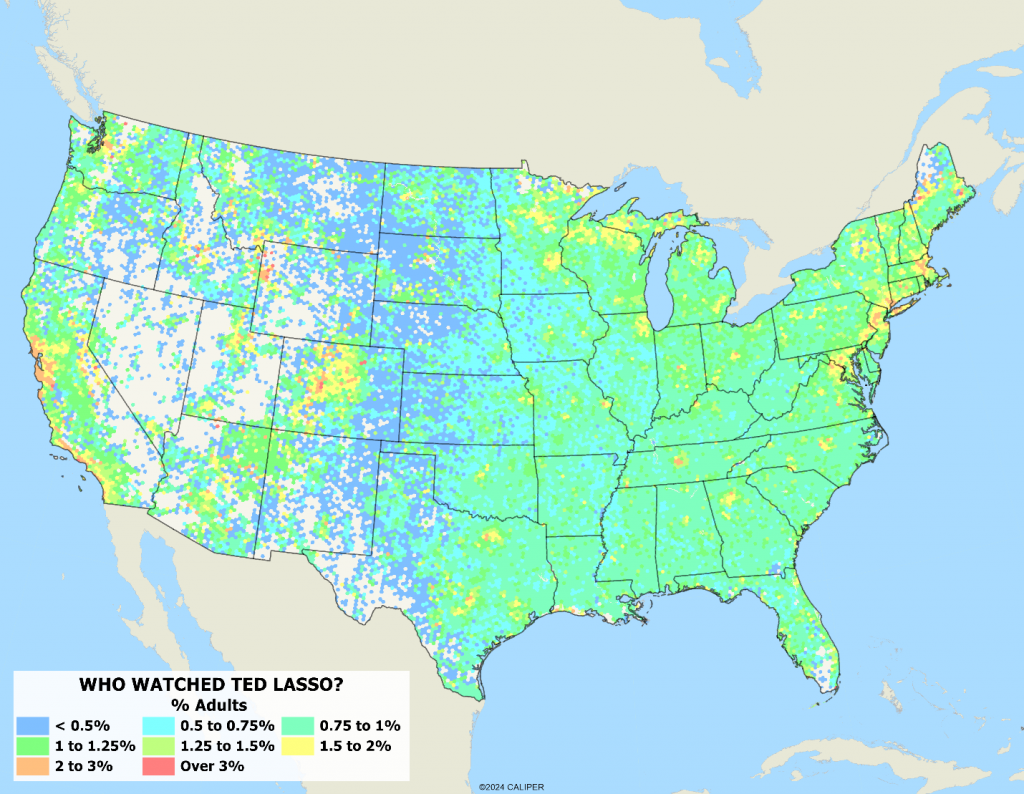
When I looked through the list, one of my favorite shows jumped out at me: Ted Lasso. It is a wonderful feat of comedic genius, and if you have never seen it, I highly recommend it. Plus, it stars KC’s own Jason Sudeikis, and everyone around here really loves the show. We produced a national level map for this variable, also using H3 hexagons, but at a level 5. By the way, those looking for a use case for this data need to only look at the merchandise created from this show. I am often seen in my Joe Arthur GateStack t-shirt, famously first worn by Lasso on the show, which is a homage to some of the famous BBQ restaurants in town. Seriously, we love that show here.
Mike, Senior Vice President
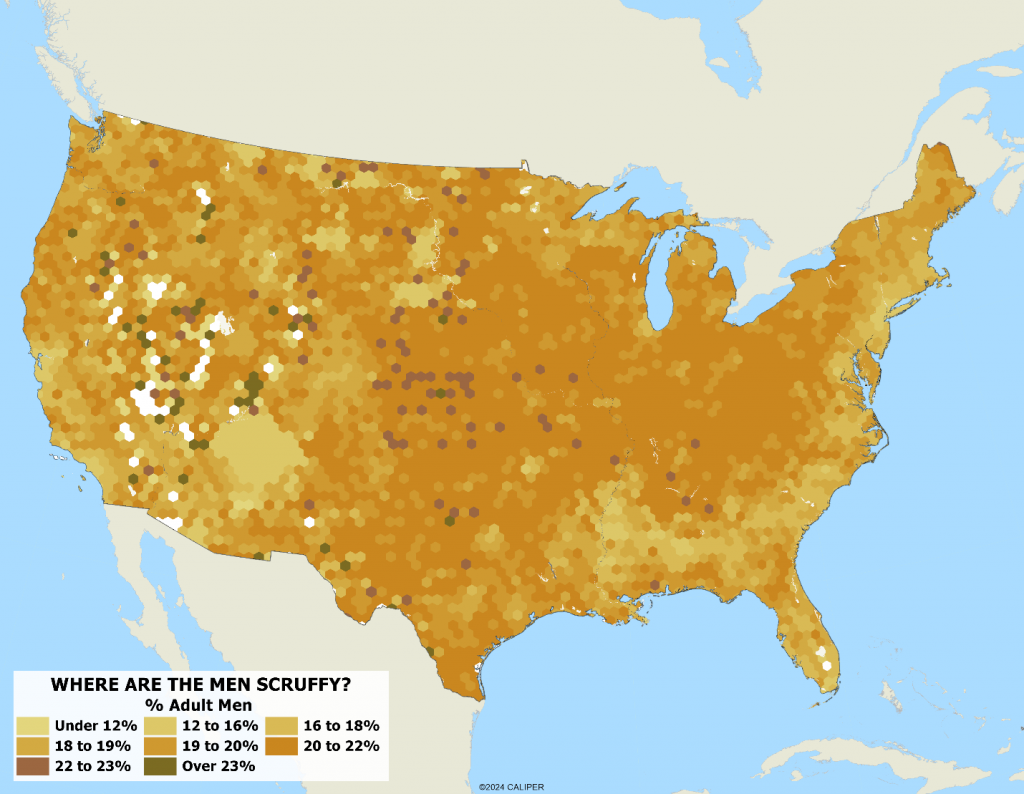
The men of AGS are known to sport beards, goatees, and other forms of scruff, so the new variables on facial hair were a hit for all of them. Where are the scruffy men, with a beard of scruff? We also mapped this variable using the H3 hexagons at level 5, nationwide to see the overall pattern. Mountain men are indeed the stereotype here for a reason.
Gary, Founder and President
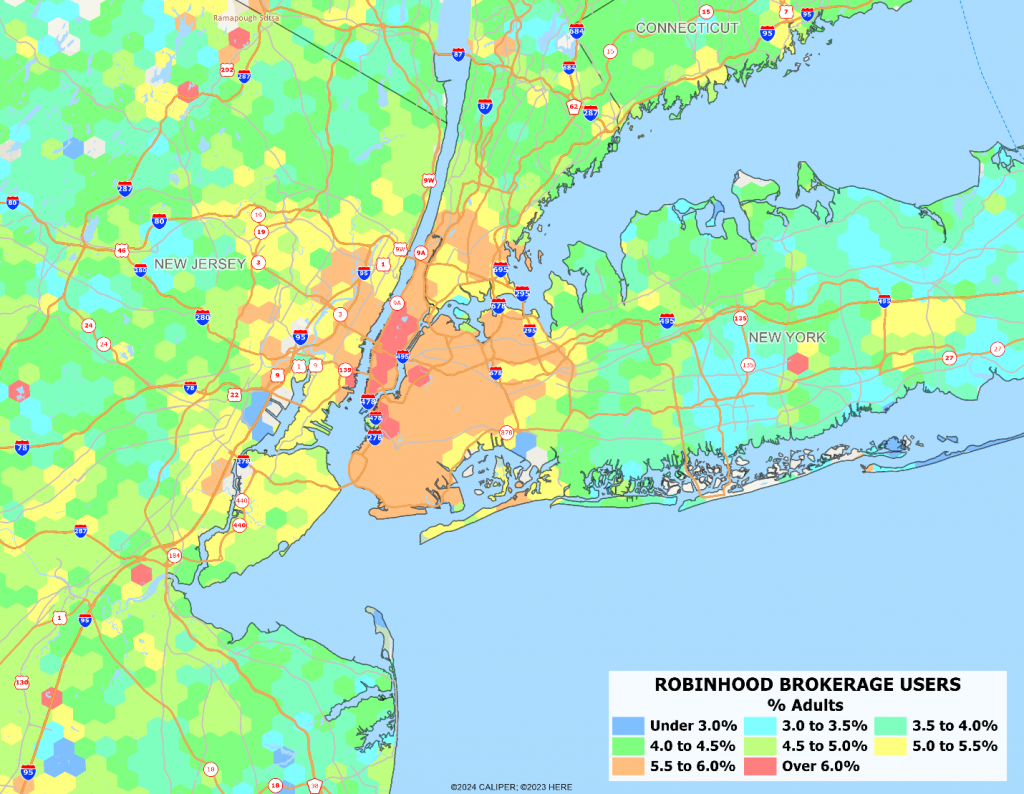
Again, from the newly revamped Assets and Debts, Gary looked at the percentage of adults using Robinhood as a brokerage account. Again, mapped using the new H3 hex level of geography on a level 7, NYC is home to the highest percentage of users in the country.
Thomas, Senior Data Scientist
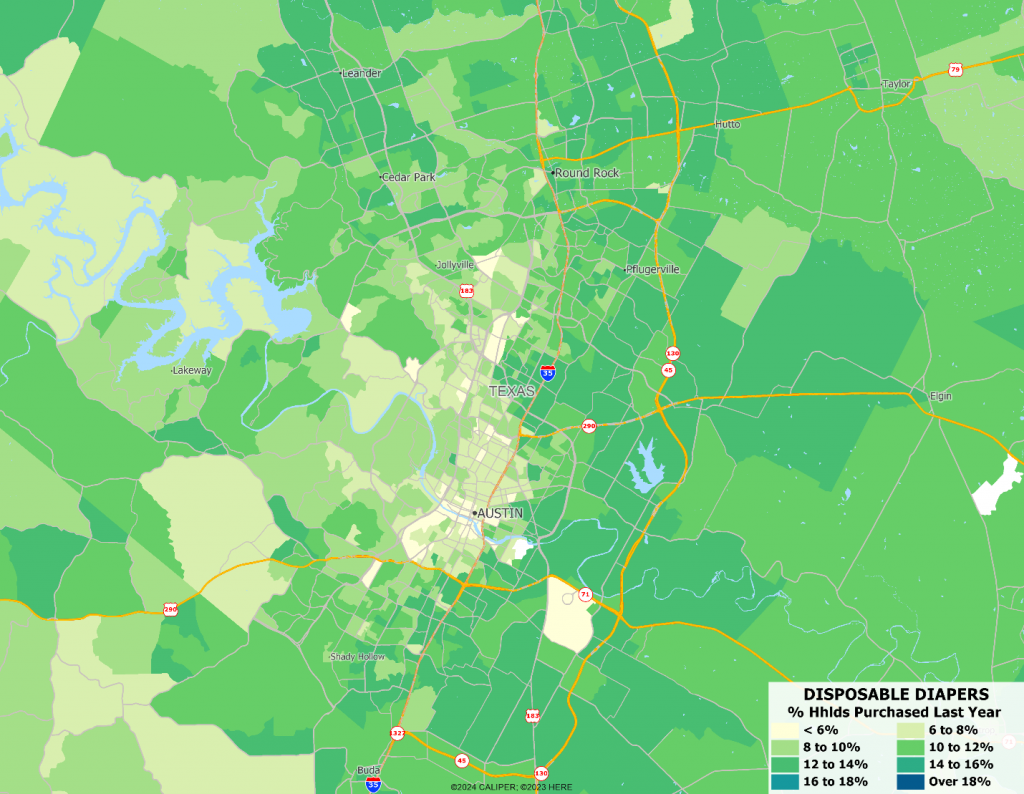
Thomas is out of the office on paternity leave, so we chose for him. We also may have chosen something that isn’t a new variable, but this felt right. For Thomas, we mapped the percentage of households that purchased disposable diapers last year and mapped it over Austin, Texas. Remember, lots of grandparents also purchase diapers! Congrats to Thomas and Jaime on the birth of their twins!


Recent Comments