
The last few weeks in Southern California have been, well, a bit soggy. To those who know the area, it is either Mr. Roger’s Neighborhood or a 1970’s cheesy Leslie Nielson disaster movie. There is nothing between the two extremes as the occasional errant summer thunderstorm that throws the entire region into a tizzy.
So, between keeping a watchful eye on my backyard drains to make sure that my living room didn’t become an indoor swimming pool and trying to fly fish the creek formerly known as a street, I got to thinking. How is it possible that California can be simultaneously being flooded out yet still be in a drought?
Here is the current drought monitor, which shows that much of California remains in the “severe drought” level (the dark orange):
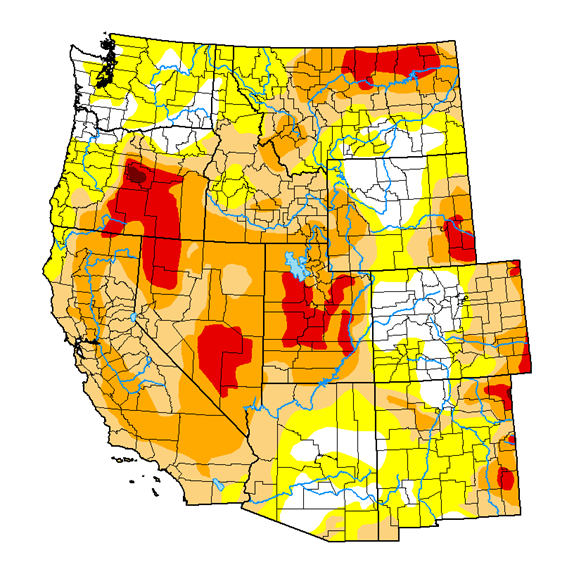
https://droughtmonitor.unl.edu/
Technically, all of California remains under drought conditions. At the same time, we have been deluged with both rain and the local news stories – the snowplows on the Pacific Coast Highway shoveling mud, truck size boulders blocking Malibu Canyon, multiple closures on the US-101 Freeway north of Ventura, and even a car-eating sinkhole in the San Fernando Valley (it ate a car and a pickup truck before the road was closed). But yet we see stories like this one in Bloomberg – “California Deluge s Still Far Too Little to End Drought’s Grip” (https://www.bloomberg.com/news/articles/2023-01-10/california-storm-atmospheric-rivers-aren-t-helping-the-drought-problem) which basically says that the water problem in California is due to the water table being diminished by years of drought.
So what gives here?
In many parts of the country, the local news will say that we are “year-to-date 2 inches below normal”. I grew up in Toronto where every 3-4 days, a front blows through, drops rain, and moves east. Normal and average are roughly equivalent terms, which makes the deviation from normal comparison quite reasonable. But in California – Ventura County to be specific – the “average” or “normal” rainfall is about 14 inches a year. But does average have any meaning here? The chart below shows the average precipitation for California over a lengthy period:
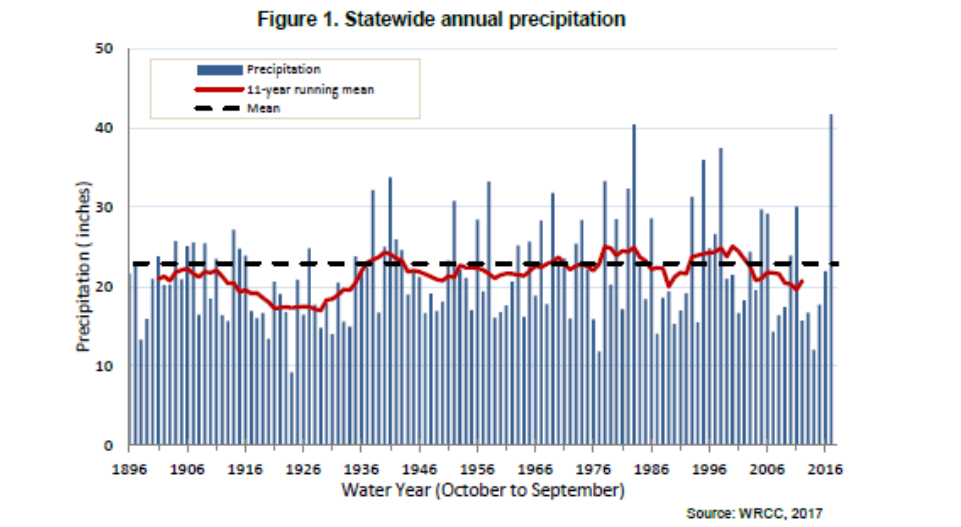
The pattern is clearly one of several years of low rainfall followed by one or two years of high rainfall. The authors of the report argue that the climate is becoming more variable over time, but quite frankly, we have not been tracking the data long enough to make definitive statements. It would be like building a model of the stock market based on 120 seconds worth of data and pretending that this was good enough to forecast the markets next Tuesday.
When we hear the term “average”, we naturally think of a normal curve around the average, but in the chart above, very few years are anywhere near the average. This is one of the critical flaws of using ‘average’ values when the data is not normally distributed. In this case, tossing out the top 10% and bottom 10% of annual records would actually yield an ‘average’ which is much more representative of the typical conditions.
The drought indexes use a combination of several different indexes with a temporal component plus observations of local conditions and generally perform reasonably well. In effect though, such measures are usually variants on the theme of deviation from the average. By definition, most of California is under at least moderate drought conditions much of the time. Uh, yeah. It’s pretty much a desert where we pump massive amounts of water in to make it look semi-tropical.
Is the drought over? No. California is in a perpetual drought or threatened drought. One good year replenishes the visible signs of adequate water supply: the reservoirs. So for now, the media will stop pushing that panic button daily and focus on other things. The politicians will move on to sexier topics in advance of their re-election campaigns. Four or five years down the road, the reservoirs will again be depleted, and the cycle will begin anew. It has been this way for the thirty years I have lived here, during which time the population has pretty much doubled, and, despite much lower per capita water use, demand has grown substantially. Supply? The basic water infrastructure has not been expanded during this time, and in fact has been diminished by the removal of dams and reservoirs.
So just like the national bridge problem, infrastructure remains the ugly stepsister of government. Understandable, as no one has ever said “I turned on my tap today, and there was water, so I shall re-elect my state Assembly member”. But the day is coming when the tap will be just a trickle, at which point something will actually be done.

Recent Comments