
In the first article in this series, we looked at edge effects – specifically, differences in trade area statistics based on the methodology of retrieval. Here we look at the effect of minor positional (where is the site?) and size (how big is the trade area?) on results. Given the similarity of our results on these two measures, we will confine discussion here to locational issues.
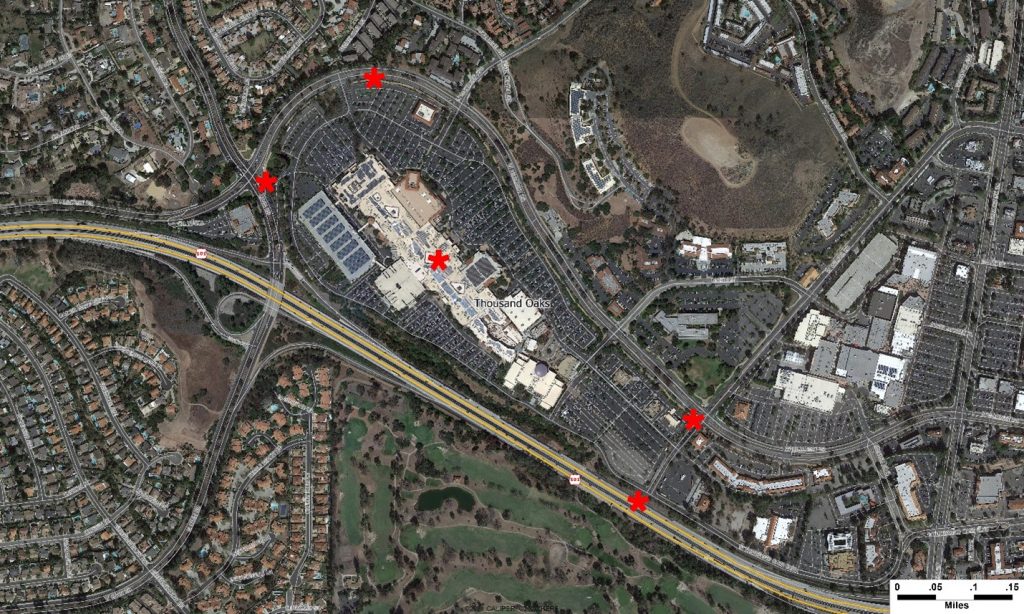
The map below shows The Oaks Mall, in Thousand Oaks California with five different points – the center point is the coordinates returned by www.maps.google, and the four corner points are at the extremes of the mall property, which is roughly ½ mile in both east-west and north-south extents.
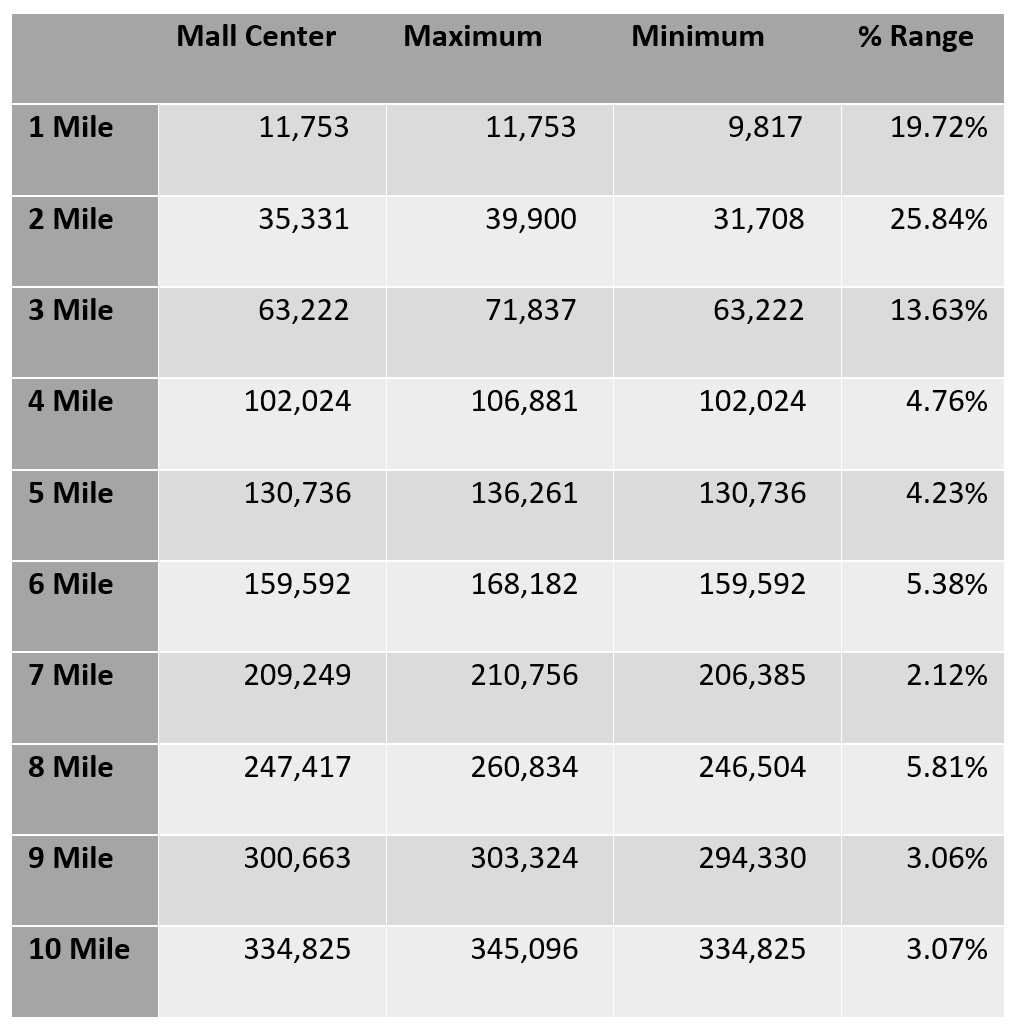
How big an impact does the precise location of the center of the radius have on the results? We used the center point as the “correct” location, then ran reports by one-mile increments. The results are not surprising: in general, the larger the radius, the less impact the precise location has on the results. We expect to find inconsistent results in mountainous areas – note the increased variability of the 2 mile radius over the 1 mile radius here –
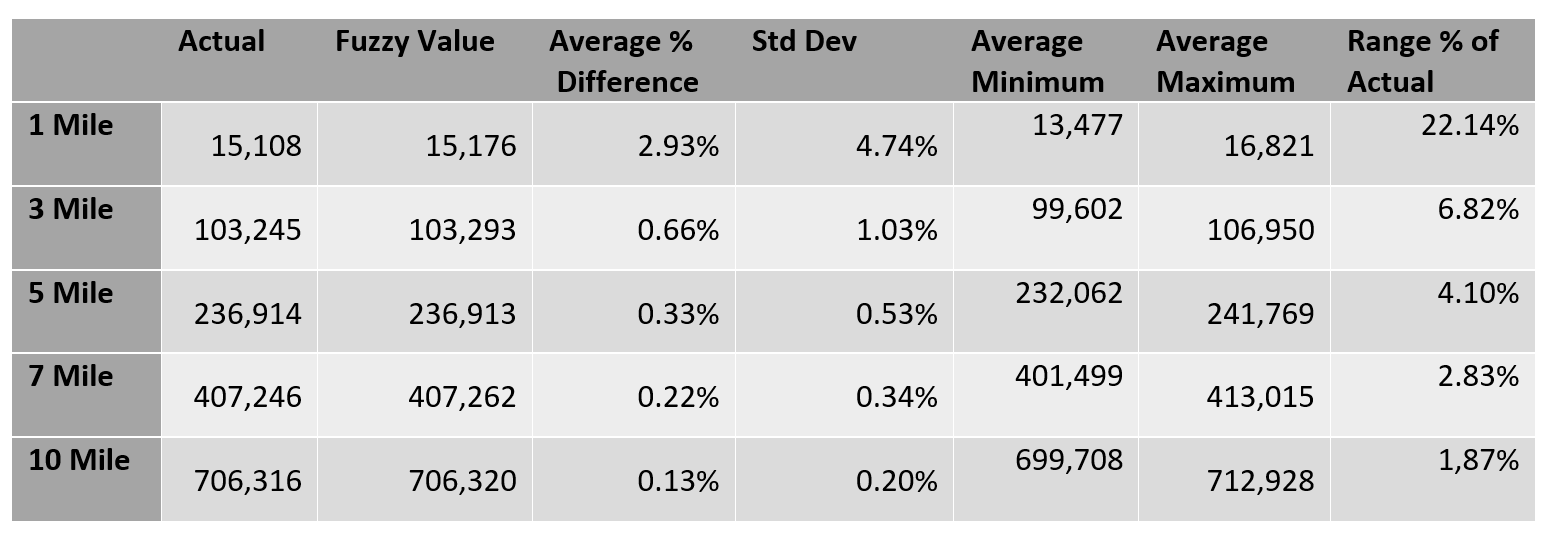
We decided to do a more rigorous examination using a sample of 5% of the block group centroids nationwide. For each point, we drop a 11×11 grid at 250’ spacing, meaning that we assemble data for 121 separate points for each trade area. The fuzzy value is the average of the inverse distance weighted population counts and the ratio between the actual and fuzzy values serves as a good indication of the sensitivity of the trade area to minor locational (or trade area size) variations.
While the average differences are small, based on the standard deviation there are clearly cases where differences are highly significant.
But what general conclusions can we reach? While the effects on trade area statistics for larger trade areas are generally minor and not likely to change many business decisions, it is vital that any “second level” screening include consideration of at least the following –
- Are there significant population clusters at the edge of the trade area? This could include group quarters populations or apartment complexes located just inside or just outside the area.
- What is the distribution of the population within the trade area? A secondary trade area analysis should at the least include detailed (block or block group level) maps of population density and income.
- Use the built-in functions that our Snapshot engine provides for doing “deep-dive” analysis on trade areas –
- The decay() function is used to identify the degree to which a variable is concentrated near the site or near the edge of the trade area
- Statistical functions can be used on any variable within a report which would allow the easy identification of significant internal variations within a study area – for any variable, you can display the maximum, minimum, average, standard deviation, and coefficient of variation. For example, a report could show the range of median incomes within a study area by using the min() and max() functions.
- The sensitivity tools used here – edge effects, positional effects, and size effects – should be used on any second level analysis in order to identify potential problems in the details.

Recent Comments